Estimated Value: $209,000 - $212,000
3
Beds
2
Baths
1,490
Sq Ft
$141/Sq Ft
Est. Value
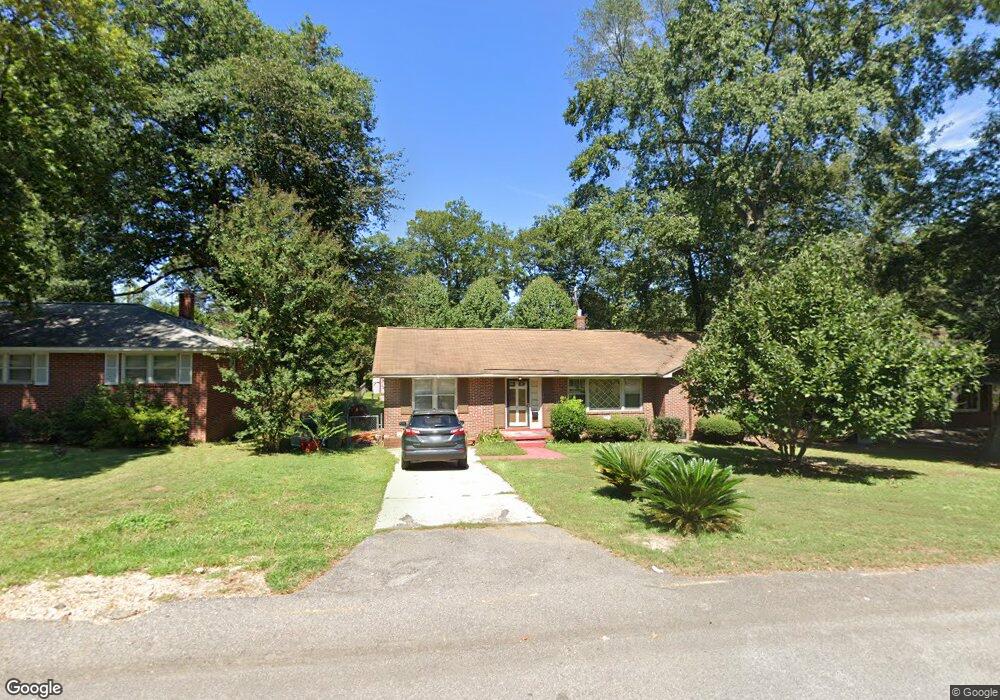
About This Home
This home is located at 1026 Pine St, Cayce, SC 29033 and is currently estimated at $210,289, approximately $141 per square foot. 1026 Pine St is a home located in Lexington County with nearby schools including Cayce Elementary, Cyril B. Busbee Creative Arts Academy, and Brookland-Cayce High School.
Ownership History
Date
Name
Owned For
Owner Type
Purchase Details
Closed on
Mar 5, 2024
Sold by
Colley Dorothy T
Bought by
Colley Christopher Shawn and Colley Dorothy T
Current Estimated Value
Purchase Details
Closed on
Aug 2, 2022
Sold by
Wesley Nelson Walter
Bought by
Colley Dorothy T
Purchase Details
Closed on
Mar 21, 2013
Sold by
Estate Of Virginia W Nelson and Nelson Walter Wesley
Bought by
Nelson Walter W
Purchase Details
Closed on
Dec 18, 2012
Sold by
Colley Dorothy T
Bought by
Nelson Walter W
Purchase Details
Closed on
Nov 1, 2011
Sold by
Estate Of Virginia W Nelson and Nelson Walter Wesley
Bought by
Nelson Walter Wesley and Colley Dorothy Teresa
Create a Home Valuation Report for This Property
The Home Valuation Report is an in-depth analysis detailing your home's value as well as a comparison with similar homes in the area
Home Values in the Area
Average Home Value in this Area
Purchase History
| Date | Buyer | Sale Price | Title Company |
|---|---|---|---|
| Colley Christopher Shawn | -- | None Listed On Document | |
| Colley Dorothy T | -- | None Listed On Document | |
| Nelson Walter W | -- | -- | |
| Nelson Walter W | -- | -- | |
| Nelson Walter Wesley | -- | -- |
Source: Public Records
Tax History
| Year | Tax Paid | Tax Assessment Tax Assessment Total Assessment is a certain percentage of the fair market value that is determined by local assessors to be the total taxable value of land and additions on the property. | Land | Improvement |
|---|---|---|---|---|
| 2024 | $918 | $6,900 | $1,200 | $5,700 |
| 2023 | $2,650 | $3,238 | $560 | $2,678 |
| 2022 | $113 | $3,238 | $560 | $2,678 |
| 2020 | $105 | $3,238 | $560 | $2,678 |
| 2019 | $126 | $3,326 | $560 | $2,766 |
| 2018 | $127 | $3,326 | $560 | $2,766 |
| 2017 | $113 | $3,326 | $560 | $2,766 |
| 2016 | $124 | $3,325 | $560 | $2,765 |
| 2014 | $100 | $3,580 | $460 | $3,120 |
| 2013 | -- | $3,580 | $460 | $3,120 |
Source: Public Records
Map
Nearby Homes
- 1137 Allen St
- 1005 Sunnyside Dr
- 2518 Stonehenge Dr
- 1512 Summerland Dr
- 133 Odell Dr
- 2533 Tiffany Trail
- 129 Odell Dr
- 2529 Stonehenge Dr
- 121 Odell Dr
- 117 Odell Dr
- 000 Frink St
- 1515 Benedict St
- 0 Benedict St
- 2312 Lucas St
- 117 Bonhill Dr
- 111 Evergreen Ln
- 1740 Sunnyside Dr
- 135 Bonhill Dr
- TBD Poplar Lots A B & C St
- 1818 Sunnyside Dr
Your Personal Tour Guide
Ask me questions while you tour the home.