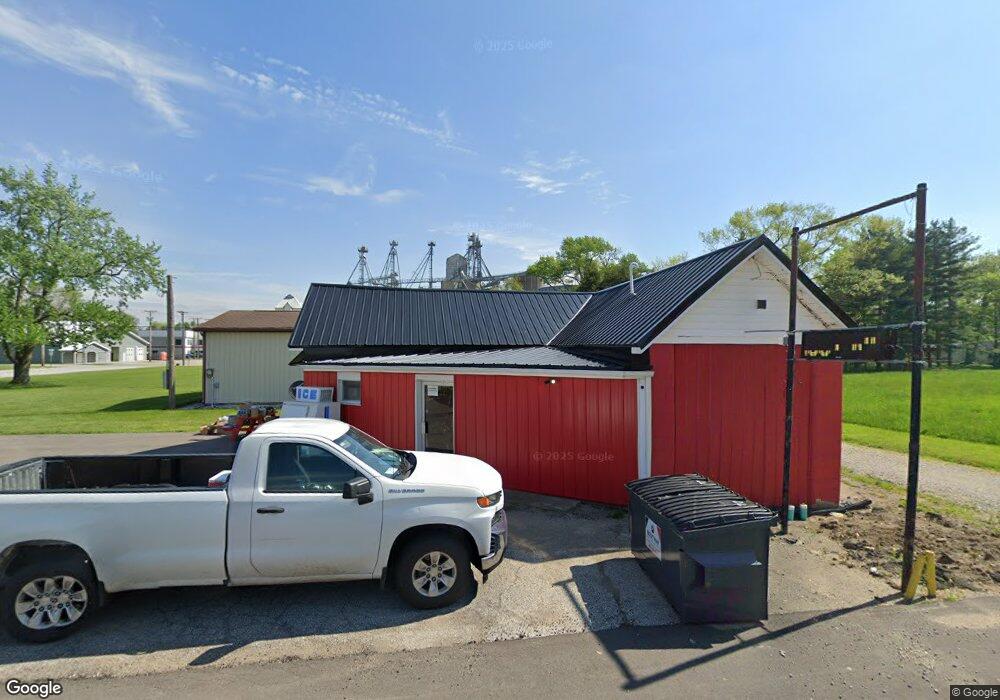
1026 S Massachusetts Ave Unit Matthews Matthews, IN 46957
Estimated Value: $214,620
--
Bed
--
Bath
917
Sq Ft
$234/Sq Ft
Est. Value
About This Home
This home is located at 1026 S Massachusetts Ave Unit Matthews, Matthews, IN 46957 and is currently priced at $214,620, approximately $234 per square foot. 1026 S Massachusetts Ave Unit Matthews is a home located in Grant County with nearby schools including Eastbrook High School.
Ownership History
Date
Name
Owned For
Owner Type
Purchase Details
Closed on
Sep 18, 2023
Sold by
Lacerda Renato
Bought by
Petroleum Testing Services Llc
Current Estimated Value
Purchase Details
Closed on
Aug 7, 2017
Sold by
Mahmood Shahid
Bought by
Renato Lacerda
Purchase Details
Closed on
Aug 3, 2017
Sold by
Mahmood Shahid
Bought by
Lacerda Renato
Purchase Details
Closed on
Jul 19, 2016
Sold by
Cihal Eric
Bought by
Alza Properties Llc
Purchase Details
Closed on
Dec 28, 2007
Sold by
Orr Kevin D and Orr Leslie M
Bought by
Roberts Jeffery
Home Financials for this Owner
Home Financials are based on the most recent Mortgage that was taken out on this home.
Original Mortgage
$13,191
Interest Rate
6.13%
Mortgage Type
Future Advance Clause Open End Mortgage
Create a Home Valuation Report for This Property
The Home Valuation Report is an in-depth analysis detailing your home's value as well as a comparison with similar homes in the area
Home Values in the Area
Average Home Value in this Area
Purchase History
| Date | Buyer | Sale Price | Title Company |
|---|---|---|---|
| Petroleum Testing Services Llc | -- | None Listed On Document | |
| Renato Lacerda | $4,000 | -- | |
| Lacerda Renato | -- | None Available | |
| Alza Properties Llc | $12,000 | -- | |
| Roberts Jeffery | -- | None Available |
Source: Public Records
Mortgage History
| Date | Status | Borrower | Loan Amount |
|---|---|---|---|
| Previous Owner | Roberts Jeffery | $13,191 |
Source: Public Records
Tax History Compared to Growth
Tax History
| Year | Tax Paid | Tax Assessment Tax Assessment Total Assessment is a certain percentage of the fair market value that is determined by local assessors to be the total taxable value of land and additions on the property. | Land | Improvement |
|---|---|---|---|---|
| 2024 | $603 | $23,200 | $9,900 | $13,300 |
| 2023 | $619 | $23,400 | $9,900 | $13,500 |
| 2022 | $668 | $23,800 | $9,900 | $13,900 |
| 2021 | $705 | $23,500 | $9,900 | $13,600 |
| 2020 | $702 | $23,500 | $9,900 | $13,600 |
| 2019 | $687 | $23,500 | $9,900 | $13,600 |
| 2018 | $690 | $24,300 | $9,900 | $14,400 |
| 2017 | $941 | $24,100 | $9,900 | $14,200 |
| 2016 | $623 | $24,100 | $9,900 | $14,200 |
| 2014 | $609 | $24,000 | $9,900 | $14,100 |
| 2013 | $609 | $23,900 | $9,900 | $14,000 |
Source: Public Records
Map
Nearby Homes
- 9261 E 1061 S
- 954 Sellers Rd
- 953 Earl Dr
- 11757 E 1000 S
- 18901 N Wheeling Ave
- 0 S 950 E Unit 202532105
- 7960 S 950 E
- 9503 S 600 E
- 5711 W County Road 1070 N Lots#10 11 12 Unit 10, 11, and 12
- 402 N Mohee Dr
- 200 N Mohee Dr
- 1 Meridian Dr
- 3177 W 200 S
- 0 N 675 Rd W Unit LotWP001 22974267
- 221 W Paulette Ave
- 217 W Price St
- 6644 E 750 S
- 2300 S 8th St
- 0 E 1050 S
- 1400 W County Road 1200 N
- 1020 Massachusetts Ave
- 1020 S Massachusetts Ave Unit 1-11
- 1020 S Massachusetts Ave
- 1027 S Massachusetts Ave
- 110 E 10th St
- TBD 11th St
- 135 E 10th St
- 11580 S Wheeling Pike
- 140 E 11th St
- 103 W 11th St
- 105 W 11th St
- 204 E 10th St
- 114 W 10th St
- 107 W 10th St
- 109 W 11th St
- 118 E 9th St
- 203 E 10th St
- 101 E 9th St
- 101 E 9th St
- 118 W 10th St