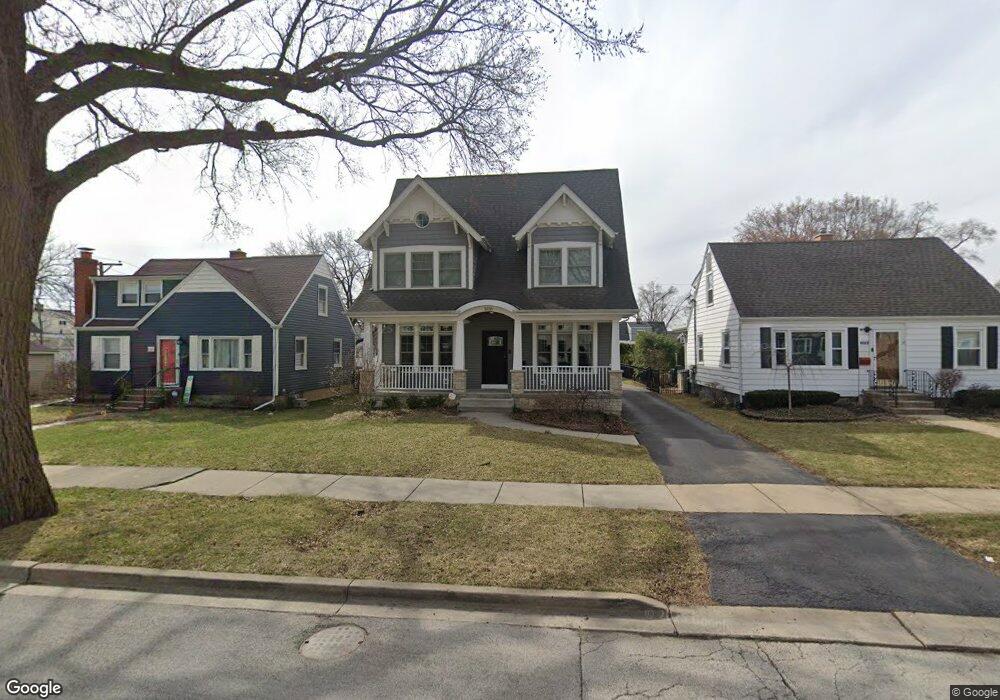
1026 S Swain Ave Elmhurst, IL 60126
Estimated Value: $762,000 - $1,093,000
--
Bed
--
Bath
2,860
Sq Ft
$346/Sq Ft
Est. Value
About This Home
This home is located at 1026 S Swain Ave, Elmhurst, IL 60126 and is currently estimated at $989,434, approximately $345 per square foot. 1026 S Swain Ave is a home located in DuPage County with nearby schools including Pulaski Intl School of Chicago, Revere Elementary School, and Jackson Elementary School.
Ownership History
Date
Name
Owned For
Owner Type
Purchase Details
Closed on
Oct 17, 2002
Sold by
Moore Mary Beth and Moore Dennis
Bought by
Mcneill Michael and Mcneill Misty
Current Estimated Value
Home Financials for this Owner
Home Financials are based on the most recent Mortgage that was taken out on this home.
Original Mortgage
$200,000
Outstanding Balance
$84,645
Interest Rate
6.29%
Estimated Equity
$904,789
Purchase Details
Closed on
Apr 15, 1999
Sold by
Corry John K
Bought by
Corry Mary Beth
Purchase Details
Closed on
Aug 11, 1998
Sold by
Horn Scott M and Horn Suzanne E
Bought by
Corry Mary Beth
Home Financials for this Owner
Home Financials are based on the most recent Mortgage that was taken out on this home.
Original Mortgage
$110,000
Interest Rate
7.07%
Purchase Details
Closed on
Apr 22, 1994
Sold by
Hines Mark B and Richards Cheryl A
Bought by
Horn Scott M and Horn Suzanne E
Home Financials for this Owner
Home Financials are based on the most recent Mortgage that was taken out on this home.
Original Mortgage
$134,000
Interest Rate
7.84%
Create a Home Valuation Report for This Property
The Home Valuation Report is an in-depth analysis detailing your home's value as well as a comparison with similar homes in the area
Home Values in the Area
Average Home Value in this Area
Purchase History
| Date | Buyer | Sale Price | Title Company |
|---|---|---|---|
| Mcneill Michael | $250,000 | Midwest Title Services Llc | |
| Corry Mary Beth | -- | -- | |
| Corry Mary Beth | $168,000 | Chicago Title Insurance Co | |
| Horn Scott M | $144,000 | First American Title Insuran |
Source: Public Records
Mortgage History
| Date | Status | Borrower | Loan Amount |
|---|---|---|---|
| Open | Mcneill Michael | $200,000 | |
| Previous Owner | Corry Mary Beth | $110,000 | |
| Previous Owner | Horn Scott M | $134,000 |
Source: Public Records
Tax History Compared to Growth
Tax History
| Year | Tax Paid | Tax Assessment Tax Assessment Total Assessment is a certain percentage of the fair market value that is determined by local assessors to be the total taxable value of land and additions on the property. | Land | Improvement |
|---|---|---|---|---|
| 2024 | $18,054 | $307,571 | $73,989 | $233,582 |
| 2023 | $16,781 | $284,420 | $68,420 | $216,000 |
| 2022 | $16,215 | $273,400 | $65,770 | $207,630 |
| 2021 | $15,818 | $266,600 | $64,130 | $202,470 |
| 2020 | $15,211 | $260,750 | $62,720 | $198,030 |
| 2019 | $15,314 | $254,610 | $59,630 | $194,980 |
| 2018 | $15,402 | $254,610 | $56,460 | $198,150 |
| 2017 | $15,076 | $242,620 | $53,800 | $188,820 |
| 2016 | $14,774 | $228,560 | $50,680 | $177,880 |
| 2015 | $14,646 | $212,930 | $47,210 | $165,720 |
| 2014 | $12,729 | $171,170 | $37,480 | $133,690 |
| 2013 | $12,588 | $173,580 | $38,010 | $135,570 |
Source: Public Records
Map
Nearby Homes
- 995 S Swain Ave
- 1005 S Mitchell Ave
- 991 S Swain Ave
- 963 S Saylor Ave
- 936 S Mitchell Ave
- 2 S Atrium Way Unit 203
- 1200 S Prospect Ave Unit 303
- 1200 S Prospect Ave Unit 108
- 110 W Butterfield Rd Unit 502S
- 100 W Butterfield Rd Unit 112N
- 175 W Brush Hill Rd Unit 404
- 1S045 Spring Rd Unit 1D
- 816 S Spring Rd
- 814 S Saylor Ave
- 130 Crab Apple Ln
- 805 S Spring Rd
- 801 S Spring Rd
- 162 E Hale St
- 762 S Saylor Ave
- 1S150 Spring Rd Unit 5B
- 1030 S Swain Ave
- 1022 S Swain Ave
- 1018 S Swain Ave
- 1014 S Swain Ave
- 263 W Butterfield Rd
- 1023 S Saylor Ave
- 1034 S Swain Ave
- 1031 S Saylor Ave
- 257 W Butterfield Rd
- 1019 S Swain Ave
- 1023 S Swain Ave
- 1027 S Saylor Ave
- 1010 S Swain Ave
- 1019 S Saylor Ave
- 1015 S Swain Ave
- 253 W Butterfield Rd
- 275 W Butterfield Rd
- 1015 S Saylor Ave
- 1011 S Swain Ave
- 1011 S Saylor Ave