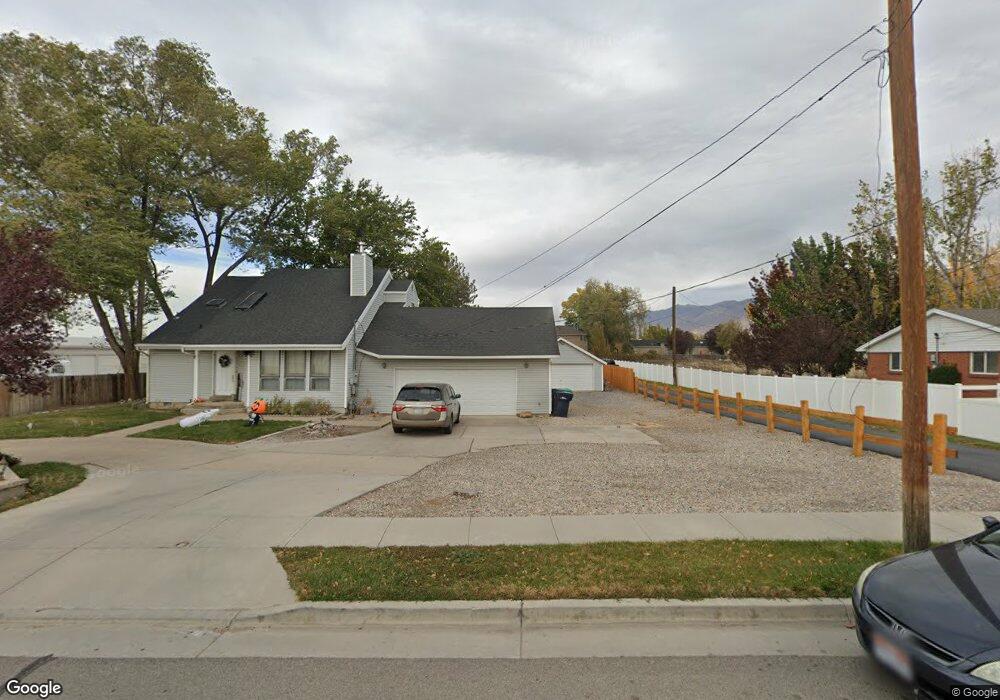
1026 W 1500 S Woods Cross, UT 84087
Estimated Value: $441,000 - $546,000
5
Beds
3
Baths
2,042
Sq Ft
$252/Sq Ft
Est. Value
About This Home
This home is located at 1026 W 1500 S, Woods Cross, UT 84087 and is currently estimated at $515,502, approximately $252 per square foot. 1026 W 1500 S is a home located in Davis County with nearby schools including Woods Cross Elementary School, Millcreek Junior High School, and Woods Cross High School.
Ownership History
Date
Name
Owned For
Owner Type
Purchase Details
Closed on
Oct 1, 2009
Sold by
West Keith A and West Jan M
Bought by
West Jan P and West Keith A
Current Estimated Value
Home Financials for this Owner
Home Financials are based on the most recent Mortgage that was taken out on this home.
Original Mortgage
$147,900
Outstanding Balance
$42,764
Interest Rate
5.14%
Mortgage Type
New Conventional
Estimated Equity
$472,738
Purchase Details
Closed on
Dec 4, 2000
Sold by
Poulson Dwight E
Bought by
West Keith A and West Jan M
Home Financials for this Owner
Home Financials are based on the most recent Mortgage that was taken out on this home.
Original Mortgage
$156,464
Interest Rate
7.86%
Purchase Details
Closed on
Jul 26, 2000
Sold by
Poulson Dwight E
Bought by
Poulson Dwight E and Poulson Lauri
Home Financials for this Owner
Home Financials are based on the most recent Mortgage that was taken out on this home.
Original Mortgage
$104,500
Interest Rate
7.62%
Mortgage Type
Construction
Create a Home Valuation Report for This Property
The Home Valuation Report is an in-depth analysis detailing your home's value as well as a comparison with similar homes in the area
Home Values in the Area
Average Home Value in this Area
Purchase History
| Date | Buyer | Sale Price | Title Company |
|---|---|---|---|
| West Jan P | -- | Cornerstone Title Ins Agency | |
| West Keith A | -- | Bonneville Title Company | |
| Poulson Dwight E | -- | Paramount Title Corp | |
| Poulson Dwight E | -- | Paramount Title Corp |
Source: Public Records
Mortgage History
| Date | Status | Borrower | Loan Amount |
|---|---|---|---|
| Open | West Jan P | $147,900 | |
| Closed | West Keith A | $156,464 | |
| Previous Owner | Poulson Dwight E | $104,500 |
Source: Public Records
Tax History Compared to Growth
Tax History
| Year | Tax Paid | Tax Assessment Tax Assessment Total Assessment is a certain percentage of the fair market value that is determined by local assessors to be the total taxable value of land and additions on the property. | Land | Improvement |
|---|---|---|---|---|
| 2025 | $2,944 | $253,000 | $86,288 | $166,712 |
| 2024 | $2,744 | $241,449 | $94,252 | $147,197 |
| 2023 | $2,622 | $236,500 | $87,212 | $149,287 |
| 2022 | $2,653 | $444,000 | $125,026 | $318,974 |
| 2021 | $2,172 | $316,000 | $102,017 | $213,983 |
| 2020 | $1,973 | $284,000 | $97,442 | $186,558 |
| 2019 | $1,940 | $275,000 | $89,652 | $185,348 |
| 2018 | $1,772 | $249,000 | $87,900 | $161,100 |
| 2016 | $1,471 | $113,025 | $41,029 | $71,996 |
| 2015 | $1,456 | $108,240 | $41,029 | $67,211 |
| 2014 | $1,255 | $95,803 | $41,029 | $54,774 |
| 2013 | -- | $103,021 | $29,379 | $73,642 |
Source: Public Records
Map
Nearby Homes
- 1137 S 1050 W
- 1623 S 925 W
- 1552 S 850 W
- 1321 S 840 W
- 1069 W Linden Ln Unit 31
- 1056 W Audrey Ln Unit 14
- 1064 W Audrey Ln Unit 15
- 1072 W Audrey Ln Unit 17
- 2024 S 925 W
- 916 W 2025 S
- 1067 W Audrey Ln Unit 8
- 1075 W Audrey Ln Unit 6
- Swiss 2 - Urban Plan at The Audrey - theAUDREY
- Swiss 3 - Urban Plan at The Audrey - theAUDREY
- Swiss 1 - Cottage Plan at The Audrey - theAUDREY
- Swiss 4 - Cottage Plan at The Audrey - theAUDREY
- Swiss 2 - Cottage Plan at The Audrey - theAUDREY
- Swiss 3 - Cottage Plan at The Audrey - theAUDREY
- Swiss 4 - Urban Plan at The Audrey - theAUDREY
- Swiss 1 - Urban Plan at The Audrey - theAUDREY