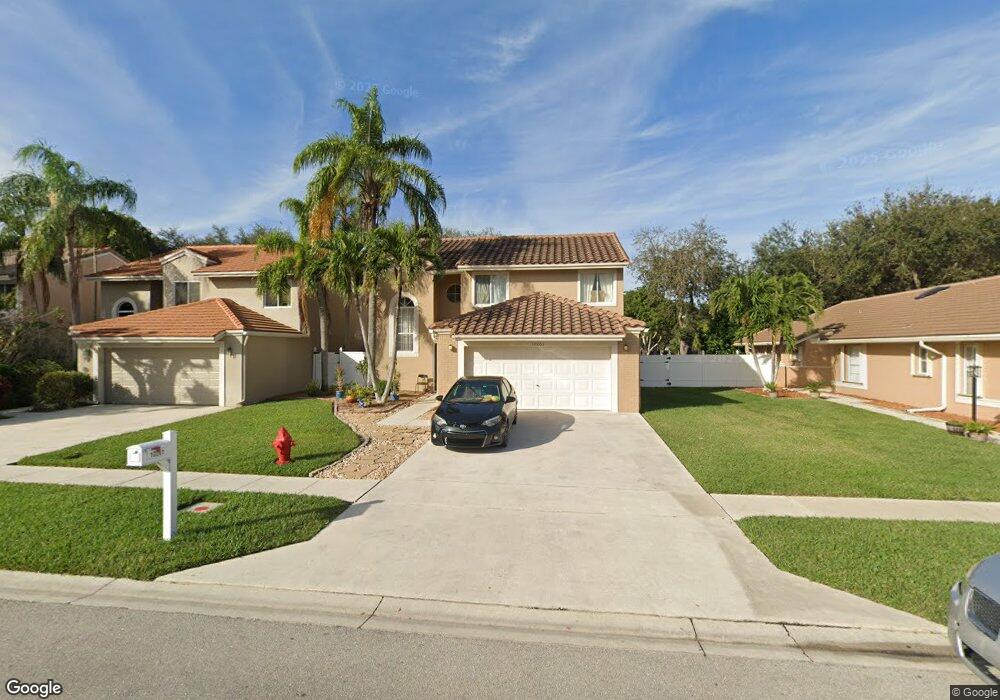
10261 Boca Springs Dr Boca Raton, FL 33428
Boca Winds NeighborhoodEstimated Value: $592,708 - $746,000
--
Bed
3
Baths
2,175
Sq Ft
$304/Sq Ft
Est. Value
About This Home
This home is located at 10261 Boca Springs Dr, Boca Raton, FL 33428 and is currently estimated at $661,177, approximately $303 per square foot. 10261 Boca Springs Dr is a home located in Palm Beach County with nearby schools including Coral Sunset Elementary School, Loggers' Run Community Middle School, and West Boca Raton High School.
Ownership History
Date
Name
Owned For
Owner Type
Purchase Details
Closed on
Aug 11, 2023
Sold by
Jones Mary and Jones Ashley S
Bought by
Jones Mary
Current Estimated Value
Purchase Details
Closed on
Sep 16, 1999
Sold by
Knecht Bruce G and Knecht Wendy E
Bought by
Jones Ashley S and Jones Mary A
Home Financials for this Owner
Home Financials are based on the most recent Mortgage that was taken out on this home.
Original Mortgage
$123,200
Interest Rate
7.91%
Mortgage Type
New Conventional
Purchase Details
Closed on
Dec 14, 1995
Sold by
Sussman Lee E and Sussman Linda M
Bought by
Knecht Bruce G and Knecht Wendy E
Home Financials for this Owner
Home Financials are based on the most recent Mortgage that was taken out on this home.
Original Mortgage
$120,000
Interest Rate
7.41%
Mortgage Type
New Conventional
Create a Home Valuation Report for This Property
The Home Valuation Report is an in-depth analysis detailing your home's value as well as a comparison with similar homes in the area
Home Values in the Area
Average Home Value in this Area
Purchase History
| Date | Buyer | Sale Price | Title Company |
|---|---|---|---|
| Jones Mary | -- | None Listed On Document | |
| Jones Mary | -- | None Listed On Document | |
| Jones Ashley S | $161,000 | -- | |
| Knecht Bruce G | $150,000 | -- |
Source: Public Records
Mortgage History
| Date | Status | Borrower | Loan Amount |
|---|---|---|---|
| Previous Owner | Knecht Bruce G | $123,200 | |
| Previous Owner | Knecht Bruce G | $20,000 | |
| Previous Owner | Knecht Bruce G | $123,200 | |
| Previous Owner | Knecht Bruce G | $120,000 |
Source: Public Records
Tax History Compared to Growth
Tax History
| Year | Tax Paid | Tax Assessment Tax Assessment Total Assessment is a certain percentage of the fair market value that is determined by local assessors to be the total taxable value of land and additions on the property. | Land | Improvement |
|---|---|---|---|---|
| 2024 | $1,739 | $224,006 | -- | -- |
| 2023 | $3,343 | $217,482 | $0 | $0 |
| 2022 | $3,304 | $211,148 | $0 | $0 |
| 2021 | $3,267 | $204,998 | $0 | $0 |
| 2020 | $3,237 | $202,168 | $0 | $0 |
| 2019 | $3,195 | $197,623 | $0 | $0 |
| 2018 | $3,035 | $193,938 | $0 | $0 |
| 2017 | $2,982 | $189,949 | $0 | $0 |
| 2016 | $2,800 | $175,831 | $0 | $0 |
| 2015 | $2,862 | $174,609 | $0 | $0 |
| 2014 | $2,868 | $173,223 | $0 | $0 |
Source: Public Records
Map
Nearby Homes
- 10008 Country Brook Rd
- 22488 Overture Cir
- 10056 Country Brook Rd
- 10429 Boca Springs Dr
- 10094 Encore Path
- 10138 Lexington Estates Blvd
- 10108 Windtree Ln S
- 22320 Holcomb Place
- 10028 Venezia Place
- 22615 SW 66th Ave Unit 1030
- 22615 SW 66th Ave Unit 3100
- 22280 Tupelo Place
- 10690 Ember St
- 22605 SW 66th Ave Unit 1020
- 22605 SW 66th Ave Unit 4090
- 22805 SW 66th 206 Ave Unit 206
- 22795 SW 66th Ave Unit 1050
- 9915 Sandalfoot Blvd Unit 418
- 10128 Boca Bend E Unit C2
- 10063 Umberland Place
- 10267 Boca Springs Dr
- 10255 Boca Springs Dr
- 10273 Boca Springs Dr
- 10249 Boca Springs Dr
- 10279 Boca Springs Dr
- 10262 Boca Springs Dr
- 10268 Boca Springs Dr
- 10256 Boca Springs Dr
- 10243 Boca Springs Dr
- 10274 Boca Springs Dr
- 10237 Boca Springs Dr
- 10291 Boca Springs Dr
- 10231 Boca Springs Dr
- 10286 Boca Springs Dr
- 10297 Boca Springs Dr
- 10225 Boca Springs Dr
- 10012 Country Brook Rd
- 10136 Country Brook Rd
- 10001 Country Brook Rd
- 10303 Boca Springs Dr