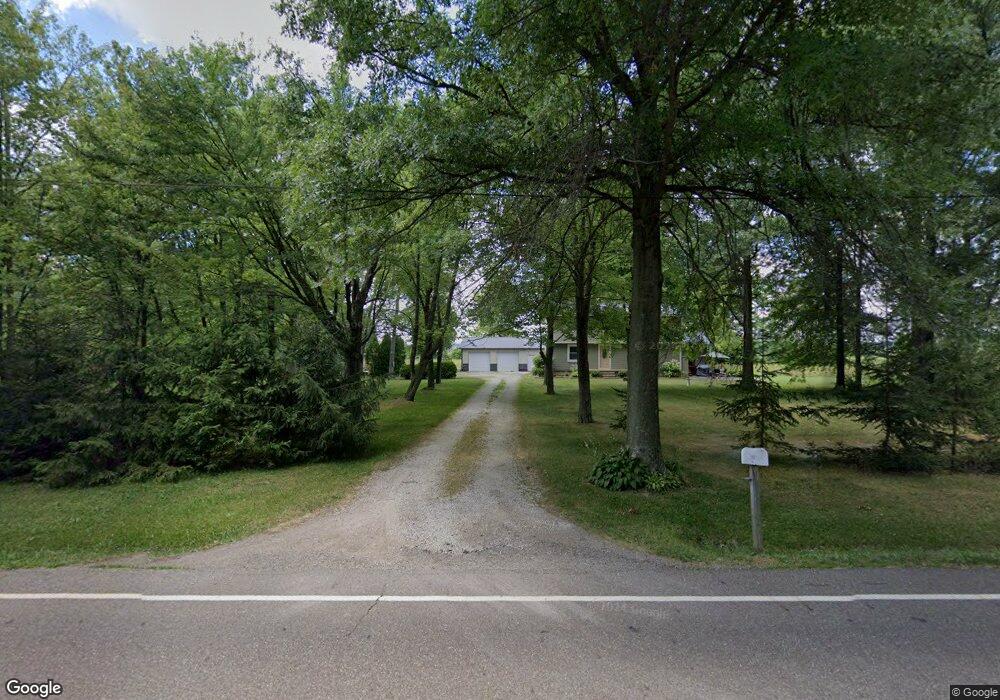
10265 Columbus Rd NE Louisville, OH 44641
Estimated Value: $309,000 - $412,000
4
Beds
3
Baths
1,920
Sq Ft
$191/Sq Ft
Est. Value
About This Home
This home is located at 10265 Columbus Rd NE, Louisville, OH 44641 and is currently estimated at $367,355, approximately $191 per square foot. 10265 Columbus Rd NE is a home located in Stark County with nearby schools including Marlington High School.
Ownership History
Date
Name
Owned For
Owner Type
Purchase Details
Closed on
Sep 21, 2009
Sold by
Hsbc Bank Usa National Association
Bought by
Beachy Matthew L and Beachy Carol G
Current Estimated Value
Home Financials for this Owner
Home Financials are based on the most recent Mortgage that was taken out on this home.
Original Mortgage
$50,000
Interest Rate
5.15%
Mortgage Type
New Conventional
Purchase Details
Closed on
May 8, 2009
Sold by
Beltz Thomas M and Beltz Mary K
Bought by
Hsbc Bank Usa Na
Purchase Details
Closed on
Apr 4, 2001
Sold by
Beltz Charles H Trustees
Bought by
Beltz Thomas M and Beltz Mary K
Home Financials for this Owner
Home Financials are based on the most recent Mortgage that was taken out on this home.
Original Mortgage
$54,100
Interest Rate
8.3%
Purchase Details
Closed on
Feb 13, 1992
Create a Home Valuation Report for This Property
The Home Valuation Report is an in-depth analysis detailing your home's value as well as a comparison with similar homes in the area
Home Values in the Area
Average Home Value in this Area
Purchase History
| Date | Buyer | Sale Price | Title Company |
|---|---|---|---|
| Beachy Matthew L | $63,000 | Attorney | |
| Hsbc Bank Usa Na | $88,000 | None Available | |
| Beltz Thomas M | -- | Trident Title Agency | |
| -- | -- | -- |
Source: Public Records
Mortgage History
| Date | Status | Borrower | Loan Amount |
|---|---|---|---|
| Closed | Beachy Matthew L | $50,000 | |
| Previous Owner | Beltz Thomas M | $54,100 |
Source: Public Records
Tax History Compared to Growth
Tax History
| Year | Tax Paid | Tax Assessment Tax Assessment Total Assessment is a certain percentage of the fair market value that is determined by local assessors to be the total taxable value of land and additions on the property. | Land | Improvement |
|---|---|---|---|---|
| 2025 | -- | $110,530 | $52,010 | $58,520 |
| 2024 | -- | $110,530 | $52,010 | $58,520 |
| 2023 | $2,996 | $81,000 | $32,030 | $48,970 |
| 2022 | $3,006 | $81,000 | $32,030 | $48,970 |
| 2021 | $3,017 | $81,000 | $32,030 | $48,970 |
| 2020 | $2,772 | $68,610 | $26,920 | $41,690 |
| 2019 | $2,752 | $64,270 | $26,920 | $37,350 |
| 2018 | $2,461 | $64,270 | $26,920 | $37,350 |
| 2017 | $1,889 | $45,660 | $21,360 | $24,300 |
| 2016 | $1,890 | $45,660 | $21,360 | $24,300 |
| 2015 | $1,893 | $45,660 | $21,360 | $24,300 |
| 2014 | $1,784 | $39,810 | $18,630 | $21,180 |
| 2013 | $873 | $39,810 | $18,630 | $21,180 |
Source: Public Records
Map
Nearby Homes
- 0 Reeder Ave NE
- 10666 Wilma Ave NE
- 12355 Edison St NE
- 2377 Ansley St Unit 2377
- 13334 Cindy St NE
- 2851 Patriots Path Unit 3D
- 2435 Queensbury Rd
- 7844 Morningstar Dr
- 0 Meadow St NE
- 1430 Westwood Ave
- 11960 Freshley Ave NE
- 0 Valewood Cir Unit 5006281
- 2081 Marwood Cir
- 12415 Snode St NE
- 13109 Edison St NE
- 0 W Main St Unit 5090123
- 0 Easton St NE
- 11480 Aebi Ave NE
- 5990 Meese Rd NE
- 0 Winchester St
- 10225 Columbus Rd NE
- 10240 Columbus Rd
- 10205 Columbus Rd NE
- 10306 Columbus Rd
- 10175 Columbus Rd NE
- 10344 Columbus Rd
- 10151 Columbus Rd NE
- 10144 Columbus Rd NE
- 10364 Columbus Rd NE
- 10375 Columbus Rd NE
- 10060 Columbus Rd NE
- 10131 Columbus Rd NE
- 10455 Columbus Rd
- 10050 Columbus Rd NE
- 10440 Columbus Rd NE
- 10440 Columbus Rd NE
- 10024 Columbus Rd NE
- 9911 Reeder Ave
- 9811 Reeder Ave NE
- 9811 Reeder Ave