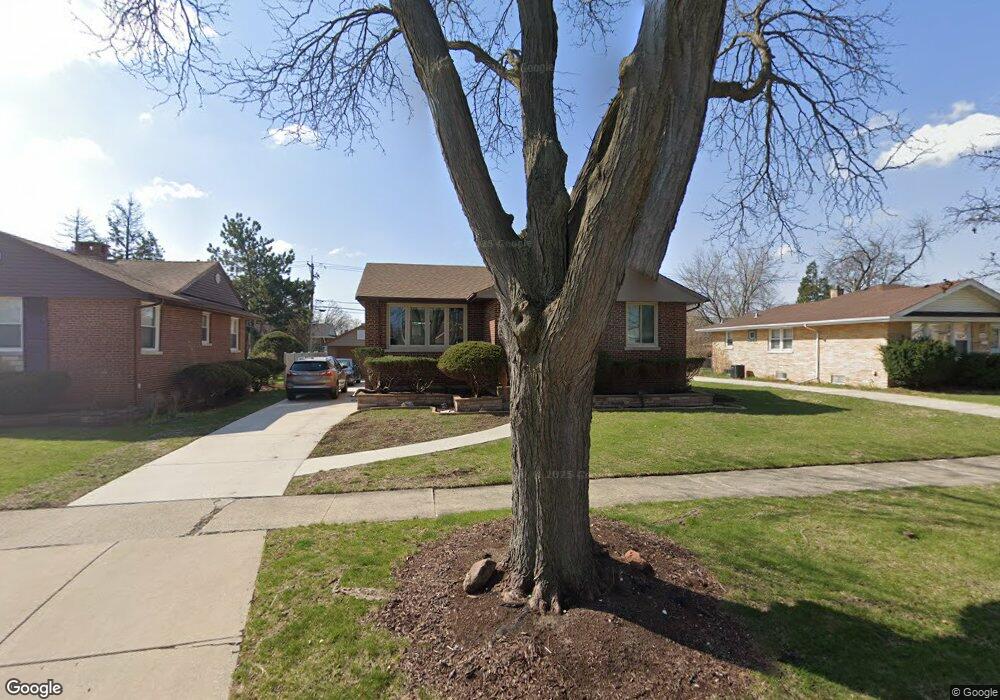
10265 Wight St Westchester, IL 60154
Estimated Value: $305,000 - $376,000
2
Beds
1
Bath
1,115
Sq Ft
$307/Sq Ft
Est. Value
About This Home
This home is located at 10265 Wight St, Westchester, IL 60154 and is currently estimated at $342,485, approximately $307 per square foot. 10265 Wight St is a home located in Cook County with nearby schools including Westchester Primary School, Westchester Intermediate School, and Westchester Middle School.
Ownership History
Date
Name
Owned For
Owner Type
Purchase Details
Closed on
Sep 17, 2011
Sold by
Nowicki Helen L and Gajkowski John
Bought by
Marrow George
Current Estimated Value
Home Financials for this Owner
Home Financials are based on the most recent Mortgage that was taken out on this home.
Original Mortgage
$3,810
Outstanding Balance
$2,594
Interest Rate
4.14%
Mortgage Type
Stand Alone Second
Estimated Equity
$339,891
Purchase Details
Closed on
Sep 14, 2011
Sold by
Nowicki Helen L and Gajkowski John
Bought by
Marrow George
Home Financials for this Owner
Home Financials are based on the most recent Mortgage that was taken out on this home.
Original Mortgage
$3,810
Outstanding Balance
$2,594
Interest Rate
4.14%
Mortgage Type
Stand Alone Second
Estimated Equity
$339,891
Purchase Details
Closed on
Feb 1, 2002
Sold by
Bowman Irene J and Nowicki Helen L
Bought by
Bowman Irene J and Nowicki Helen L
Create a Home Valuation Report for This Property
The Home Valuation Report is an in-depth analysis detailing your home's value as well as a comparison with similar homes in the area
Home Values in the Area
Average Home Value in this Area
Purchase History
| Date | Buyer | Sale Price | Title Company |
|---|---|---|---|
| Marrow George | -- | Chicago Title Insurance Co | |
| Marrow George | $127,000 | Chicago Title Insurance Co | |
| Bowman Irene J | -- | -- |
Source: Public Records
Mortgage History
| Date | Status | Borrower | Loan Amount |
|---|---|---|---|
| Open | Marrow George | $3,810 | |
| Open | Marrow George | $123,780 |
Source: Public Records
Tax History Compared to Growth
Tax History
| Year | Tax Paid | Tax Assessment Tax Assessment Total Assessment is a certain percentage of the fair market value that is determined by local assessors to be the total taxable value of land and additions on the property. | Land | Improvement |
|---|---|---|---|---|
| 2024 | $5,954 | $26,000 | $5,544 | $20,456 |
| 2023 | $5,016 | $26,000 | $5,544 | $20,456 |
| 2022 | $5,016 | $19,860 | $4,752 | $15,108 |
| 2021 | $4,882 | $19,860 | $4,752 | $15,108 |
| 2020 | $4,835 | $19,860 | $4,752 | $15,108 |
| 2019 | $4,645 | $19,872 | $4,356 | $15,516 |
| 2018 | $4,583 | $19,872 | $4,356 | $15,516 |
| 2017 | $4,511 | $19,872 | $4,356 | $15,516 |
| 2016 | $4,164 | $16,776 | $3,960 | $12,816 |
| 2015 | $4,075 | $16,776 | $3,960 | $12,816 |
| 2014 | $4,718 | $16,776 | $3,960 | $12,816 |
| 2013 | $4,730 | $18,816 | $3,960 | $14,856 |
Source: Public Records
Map
Nearby Homes
- 10324 Wight St
- 1803 Balmoral Ave
- 1847 Newcastle Ave
- 1908 Belleview Ave
- 10567 Waterford Dr
- 10531 Camelot St
- 1318 Balmoral Ave
- 10524 Camelot St
- 1406 Portsmouth Ave
- 1907 Suffolk Ave
- 10461 Dorchester St
- 1245 S Mannheim Rd Unit 2
- 1247 S Mannheim Rd Unit 3
- 1244 Westchester Blvd
- 1816 Manchester Ave
- 1811 Downing Ave
- 1860 Buckingham Ave
- 1921 Buckingham Ave
- 1900 Manchester Ave
- 1813 Manchester Ave