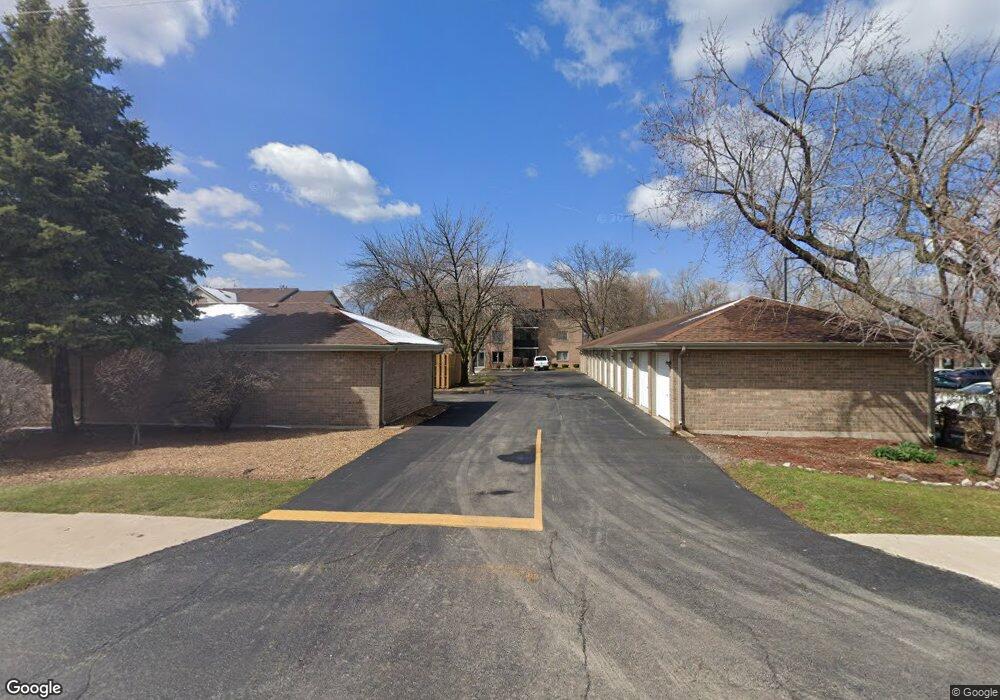
10268 Southwest Hwy Unit 42A Chicago Ridge, IL 60415
Estimated Value: $195,000 - $217,000
2
Beds
2
Baths
1,168
Sq Ft
$179/Sq Ft
Est. Value
About This Home
This home is located at 10268 Southwest Hwy Unit 42A, Chicago Ridge, IL 60415 and is currently estimated at $209,350, approximately $179 per square foot. 10268 Southwest Hwy Unit 42A is a home located in Cook County with nearby schools including Ernest F Kolb Elementary School, Simmons Middle School, and Harold L. Richards High School.
Ownership History
Date
Name
Owned For
Owner Type
Purchase Details
Closed on
Jan 19, 2024
Sold by
Brown Thomas and Brown Joseph C
Bought by
Kotlarczyk Grzegorz and Kotlarczyk Bozena
Current Estimated Value
Home Financials for this Owner
Home Financials are based on the most recent Mortgage that was taken out on this home.
Original Mortgage
$148,000
Outstanding Balance
$145,376
Interest Rate
6.88%
Mortgage Type
New Conventional
Estimated Equity
$63,974
Purchase Details
Closed on
Aug 23, 2013
Sold by
Brown Joseph C
Bought by
Brown Joseph C and Brown Daniel
Purchase Details
Closed on
Aug 21, 2013
Sold by
Brown Joseph C
Bought by
Brown Thomas
Purchase Details
Closed on
Sep 28, 1995
Sold by
Standard Bank & Trust Company
Bought by
Brown Joseph C and Brown Corena
Create a Home Valuation Report for This Property
The Home Valuation Report is an in-depth analysis detailing your home's value as well as a comparison with similar homes in the area
Home Values in the Area
Average Home Value in this Area
Purchase History
| Date | Buyer | Sale Price | Title Company |
|---|---|---|---|
| Kotlarczyk Grzegorz | $185,000 | Chicago Title | |
| Brown Joseph C | -- | Chicago Title Insruance Comp | |
| Brown Thomas | $100,000 | None Available | |
| Brown Joseph C | $108,000 | -- |
Source: Public Records
Mortgage History
| Date | Status | Borrower | Loan Amount |
|---|---|---|---|
| Open | Kotlarczyk Grzegorz | $148,000 |
Source: Public Records
Tax History Compared to Growth
Tax History
| Year | Tax Paid | Tax Assessment Tax Assessment Total Assessment is a certain percentage of the fair market value that is determined by local assessors to be the total taxable value of land and additions on the property. | Land | Improvement |
|---|---|---|---|---|
| 2024 | $4,685 | $17,840 | $1,660 | $16,180 |
| 2023 | $2,672 | $17,840 | $1,660 | $16,180 |
| 2022 | $2,672 | $10,861 | $1,925 | $8,936 |
| 2021 | $2,592 | $10,861 | $1,925 | $8,936 |
| 2020 | $2,880 | $10,861 | $1,925 | $8,936 |
| 2019 | $1,597 | $7,766 | $1,726 | $6,040 |
| 2018 | $2,138 | $9,507 | $1,726 | $7,781 |
| 2017 | $2,188 | $9,507 | $1,726 | $7,781 |
| 2016 | $3,261 | $11,083 | $1,460 | $9,623 |
| 2015 | $3,159 | $11,083 | $1,460 | $9,623 |
| 2014 | $3,120 | $11,083 | $1,460 | $9,623 |
| 2013 | $4,066 | $12,129 | $1,460 | $10,669 |
Source: Public Records
Map
Nearby Homes
- 10278 Southwest Hwy Unit 2C
- 10228 Southwest Hwy Unit 1C
- 6517 102nd Place
- 6737 104th Place
- 10437 Natoma Ave Unit 6
- 10306 Ridgeland Ave Unit 104
- 10501 S Highland Ave Unit 305
- 10504 S Highland Ave Unit 1A
- 10516 Ridge Cove Dr Unit 36C
- 10512 Ridge Cove Dr Unit 11C
- 10508 Ridge Cove Dr Unit 18D
- 10501 Forest Ln
- 10528 Ridge Cove Dr Unit 11A
- 6345 Birmingham St Unit 3C
- 10306 Kerry Ridge Ct
- 10600 S Highland Ave
- 7008 Oconnell Dr Unit 201
- 9805 Normandy Ave
- 9808 Normandy Ave
- 7048 Oconnell Dr Unit 3W
- 10268 Southwest Hwy Unit 3C
- 10268 Southwest Hwy Unit 1B
- 10268 Southwest Hwy Unit 42C
- 10268 Southwest Hwy Unit 42D
- 10268 Southwest Hwy Unit 41C
- 10268 Southwest Hwy Unit 41B
- 10268 Southwest Hwy Unit 41A
- 10268 Southwest Hwy Unit 43C
- 10268 Southwest Hwy Unit 43D
- 10268 Southwest Hwy Unit 42B
- 10268 Southwest Hwy Unit 43B
- 10268 Southwest Hwy Unit 43A
- 10268 Southwest Hwy Unit 41D
- 10268 Southwest Hwy Unit 2A
- 10268 Southwest Hwy Unit 1A
- 10268 Southwest Hwy Unit 1D
- 10268 Southwest Hwy Unit 1C
- 10268 Southwest Hwy Unit 43D
- 10268 Southwest Hwy Unit 2A
- 10278 Southwest Hwy Unit 1C