Estimated Value: $394,000 - $426,000
3
Beds
2
Baths
1,644
Sq Ft
$251/Sq Ft
Est. Value
About This Home
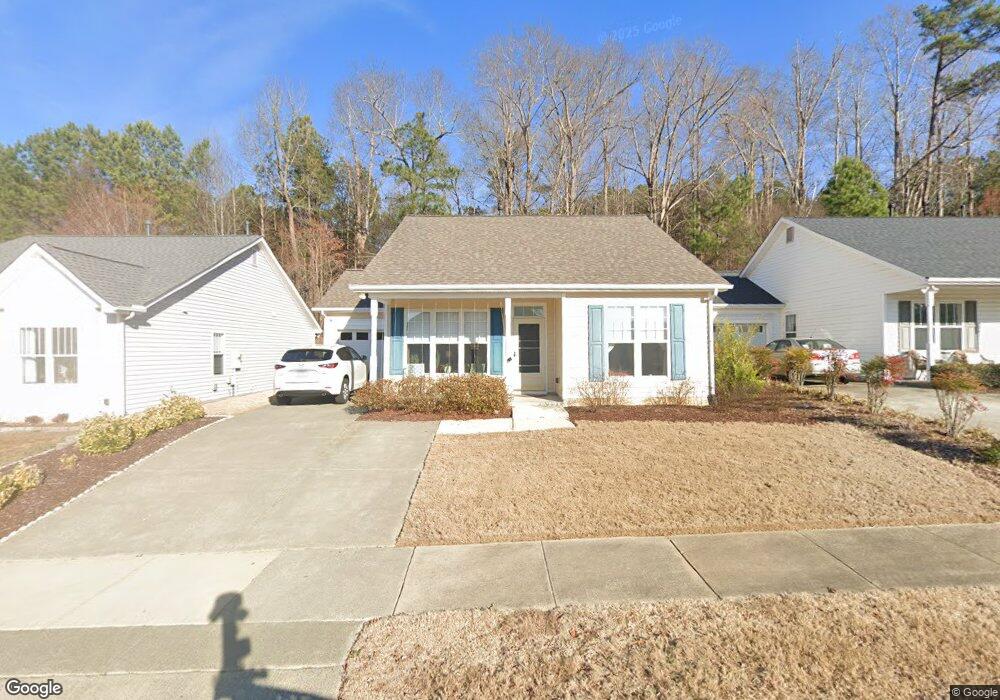
This home is located at 1027 Dual Parks Rd, Apex, NC 27502 and is currently estimated at $412,806, approximately $251 per square foot. 1027 Dual Parks Rd is a home located in Wake County with nearby schools including Apex Elementary School, Apex Middle, and Apex High School.
Ownership History
Date
Name
Owned For
Owner Type
Purchase Details
Closed on
Jan 17, 2017
Sold by
Ballman Ii Eric C
Bought by
Doyle Andrew and Doyle Lauren
Current Estimated Value
Home Financials for this Owner
Home Financials are based on the most recent Mortgage that was taken out on this home.
Original Mortgage
$148,000
Outstanding Balance
$121,826
Interest Rate
4.08%
Mortgage Type
New Conventional
Estimated Equity
$290,980
Purchase Details
Closed on
Oct 13, 2011
Sold by
Ballman Catherine and Ballman Eric C
Bought by
Ballman Eric C
Purchase Details
Closed on
Feb 16, 2007
Sold by
Ballman Wilbur H and Ballman Catherine
Bought by
Ballman Wilbur H and Ballman Catherine
Purchase Details
Closed on
Nov 15, 2002
Sold by
Homeplaces Llc
Bought by
Ballman Wilbur H and Ballman Catherine
Home Financials for this Owner
Home Financials are based on the most recent Mortgage that was taken out on this home.
Original Mortgage
$75,000
Interest Rate
5.57%
Create a Home Valuation Report for This Property
The Home Valuation Report is an in-depth analysis detailing your home's value as well as a comparison with similar homes in the area
Home Values in the Area
Average Home Value in this Area
Purchase History
| Date | Buyer | Sale Price | Title Company |
|---|---|---|---|
| Doyle Andrew | $185,000 | None Available | |
| Ballman Eric C | -- | None Available | |
| Ballman Wilbur H | -- | None Available | |
| Ballman Wilbur H | $134,500 | -- |
Source: Public Records
Mortgage History
| Date | Status | Borrower | Loan Amount |
|---|---|---|---|
| Open | Doyle Andrew | $148,000 | |
| Previous Owner | Ballman Wilbur H | $75,000 |
Source: Public Records
Tax History Compared to Growth
Tax History
| Year | Tax Paid | Tax Assessment Tax Assessment Total Assessment is a certain percentage of the fair market value that is determined by local assessors to be the total taxable value of land and additions on the property. | Land | Improvement |
|---|---|---|---|---|
| 2025 | $3,504 | $399,062 | $150,000 | $249,062 |
| 2024 | $3,426 | $399,062 | $150,000 | $249,062 |
| 2023 | $2,674 | $241,956 | $62,000 | $179,956 |
| 2022 | $2,511 | $241,956 | $62,000 | $179,956 |
| 2021 | $2,415 | $241,956 | $62,000 | $179,956 |
| 2020 | $2,391 | $241,956 | $62,000 | $179,956 |
| 2019 | $2,133 | $186,011 | $62,000 | $124,011 |
| 2018 | $2,009 | $186,011 | $62,000 | $124,011 |
| 2017 | $1,871 | $186,011 | $62,000 | $124,011 |
| 2016 | $1,844 | $186,011 | $62,000 | $124,011 |
| 2015 | -- | $164,144 | $40,500 | $123,644 |
| 2014 | -- | $164,144 | $40,500 | $123,644 |
Source: Public Records
Map
Nearby Homes
- 1039 Dual Parks Rd
- 335 Anterbury Dr
- 0-2932 Tingen Rd
- 359 Anterbury Dr
- 318 Glaston Ct
- 1464 Padstone Dr
- 1023 Irongate Dr
- 1434 Salem Creek Dr
- 1614 Brussels Dr
- 1004 Marston Ct
- 406 S Salem St
- 1787 Flint Valley Ln
- 1840 Flint Valley Ln
- 1104 Barrow Nook Ct
- 632 Briarcliff St
- 307 S Elm St
- 410 2nd St
- 105 Cunningham St
- 202 W Chatham St
- 311 Culvert St
- 1029 Dual Parks Rd
- 1025 Dual Parks Rd
- 1023 Dual Parks Rd
- 1031 Dual Parks Rd
- 1040 Dual Parks Rd
- 1021 Dual Parks Rd
- 1042 Dual Parks Rd
- 1033 Dual Parks Rd
- 1024 Dual Parks Rd
- 1035 Dual Parks Rd
- 1044 Dual Park
- 1044 Dual Parks Rd
- 1019 Dual Parks Rd
- 1037 Dual Park
- 1037 Dual Parks Rd
- 1020 Dual Park
- 1020 Dual Parks Rd
- 1018 Dual Parks Rd
- 1041 Dual Parks Rd
- 1017 Dual Parks Rd