1027 Highview St Langley, WA 98260
Estimated Value: $733,079 - $852,000
2
Beds
2
Baths
1,512
Sq Ft
$521/Sq Ft
Est. Value
About This Home
This home is located at 1027 Highview St, Langley, WA 98260 and is currently estimated at $787,020, approximately $520 per square foot. 1027 Highview St is a home located in Island County with nearby schools including South Whidbey Elementary School, South Whidbey Middle School, and South Whidbey High School.
Ownership History
Date
Name
Owned For
Owner Type
Purchase Details
Closed on
Jul 13, 2022
Sold by
Walker Tamara M and Walker Steven W
Bought by
Attebery Mary Elizabeth
Current Estimated Value
Purchase Details
Closed on
Nov 16, 2015
Sold by
Liabhart Rory and Nine Anna Genevieve
Bought by
Walker Tamara M and Smith Steven W
Home Financials for this Owner
Home Financials are based on the most recent Mortgage that was taken out on this home.
Original Mortgage
$288,000
Interest Rate
3.71%
Mortgage Type
New Conventional
Purchase Details
Closed on
Jun 28, 2010
Sold by
The Highlands At Langley Inc
Bought by
Liebhart Rory and Nine Anna Genevieve
Home Financials for this Owner
Home Financials are based on the most recent Mortgage that was taken out on this home.
Original Mortgage
$296,100
Interest Rate
4.82%
Mortgage Type
New Conventional
Create a Home Valuation Report for This Property
The Home Valuation Report is an in-depth analysis detailing your home's value as well as a comparison with similar homes in the area
Home Values in the Area
Average Home Value in this Area
Purchase History
| Date | Buyer | Sale Price | Title Company |
|---|---|---|---|
| Attebery Mary Elizabeth | $679,000 | None Listed On Document | |
| Walker Tamara M | $360,000 | Land Title & Escrow Island C | |
| Liebhart Rory | $329,000 | Chicago Title Insurance Co |
Source: Public Records
Mortgage History
| Date | Status | Borrower | Loan Amount |
|---|---|---|---|
| Previous Owner | Walker Tamara M | $288,000 | |
| Previous Owner | Liebhart Rory | $296,100 |
Source: Public Records
Tax History
| Year | Tax Paid | Tax Assessment Tax Assessment Total Assessment is a certain percentage of the fair market value that is determined by local assessors to be the total taxable value of land and additions on the property. | Land | Improvement |
|---|---|---|---|---|
| 2025 | $5,951 | $681,710 | $390,000 | $291,710 |
| 2024 | $4,993 | $683,959 | $390,000 | $293,959 |
| 2023 | $4,993 | $676,367 | $380,000 | $296,367 |
| 2022 | $4,775 | $595,546 | $325,000 | $270,546 |
| 2021 | $4,621 | $537,153 | $300,000 | $237,153 |
| 2020 | $3,753 | $526,369 | $300,000 | $226,369 |
| 2019 | $3,178 | $426,153 | $260,000 | $166,153 |
| 2018 | $3,421 | $381,675 | $225,000 | $156,675 |
| 2017 | $2,839 | $382,514 | $225,000 | $157,514 |
| 2016 | $2,872 | $344,189 | $185,000 | $159,189 |
| 2015 | -- | $338,911 | $180,000 | $158,911 |
| 2013 | -- | $296,639 | $140,000 | $156,639 |
Source: Public Records
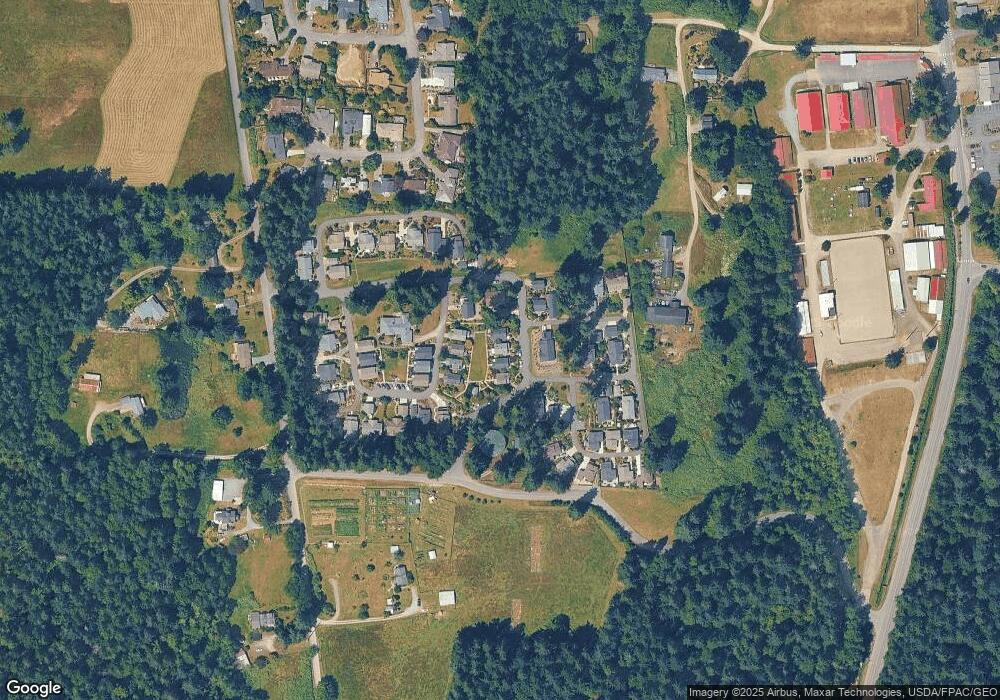
Map
Nearby Homes
- 240 Clover Ct
- 730 Gleason Ln
- 566 Creekside Terrace Unit 101
- 321 Edgecliff Dr
- 683 3rd St Unit 1(A)
- 0 XXX Sandy Point Rd
- 0 XXX Coles Rd
- 624 A, B & C 2nd St
- 0 Captain Vancouver Dr Unit NWM2442158
- 0 Primavera Place
- 5180 Camelot Ct
- 4773 Whale Walk
- 4865 Saratoga Rd
- 4282 Witter Rd
- 0 XXX Waterside Ln
- 5474 Wilkinson Rd
- 4976 Carlie Dr
- 4955 Wheel Dr
- 11652 State Route 525
- 0 April Dr
- 1027 High View St
- 1021 Highview St
- 1033 Highview St
- 1037 High View St
- 1037 Highview St
- 1017 Highview St
- 1092 Village Loop
- 1086 Village Loop
- 1098 Village Loop
- 233 Bowery Loop
- 1092 High View St
- 1080 Village Loop
- 1017 High View St
- 1074 Village Loop
- 234 Bowery Loop
- 238 Clover Ct
- 1085 Village Loop
- 1055 Village Loop
- 1095 Village Loop
- 225 Bowery Loop
Your Personal Tour Guide
Ask me questions while you tour the home.