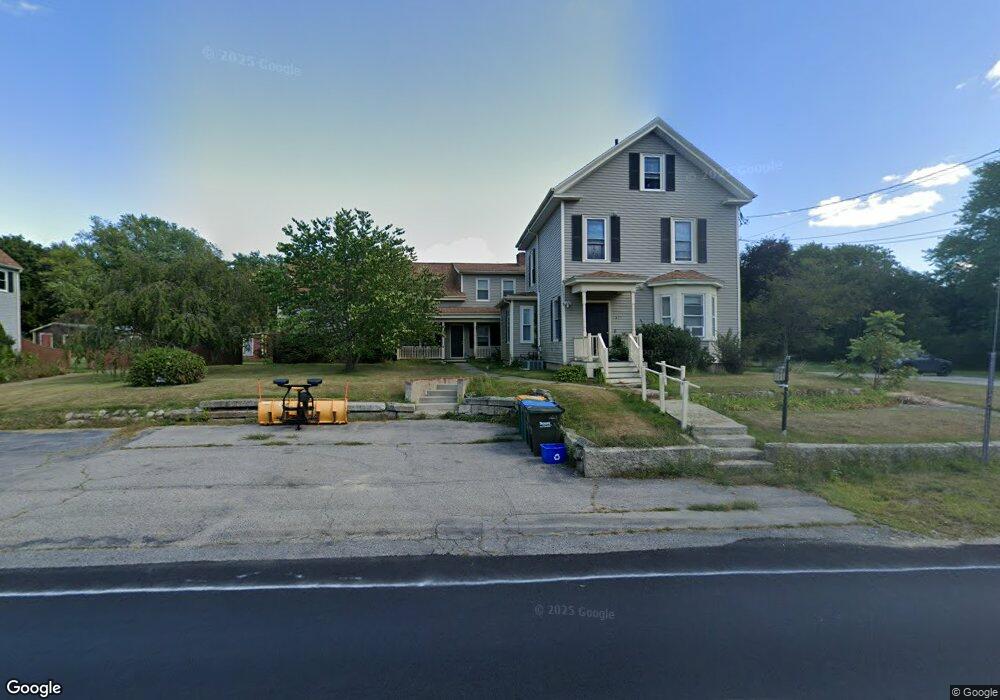
1027 Main St Unit 1 Hanover, MA 02339
Estimated Value: $808,000 - $956,000
1
Bed
1
Bath
800
Sq Ft
$1,105/Sq Ft
Est. Value
About This Home
This home is located at 1027 Main St Unit 1, Hanover, MA 02339 and is currently estimated at $883,875, approximately $1,104 per square foot. 1027 Main St Unit 1 is a home located in Plymouth County with nearby schools including Hanover High School, South Shore Charter Public School, and Norwell KinderCare.
Ownership History
Date
Name
Owned For
Owner Type
Purchase Details
Closed on
May 23, 2014
Sold by
Bunker Christopher
Bought by
1027 Main Street Rt and Bunker
Current Estimated Value
Purchase Details
Closed on
Mar 12, 2010
Sold by
Bunker Nancy
Bought by
Bunker Christopher
Create a Home Valuation Report for This Property
The Home Valuation Report is an in-depth analysis detailing your home's value as well as a comparison with similar homes in the area
Home Values in the Area
Average Home Value in this Area
Purchase History
We collect this data history from publicly available records. To have your information removed, we recommend requesting removal directly through your county’s website.
| Date | Buyer | Sale Price | Title Company |
|---|---|---|---|
| 1027 Main Street Rt | $350,000 | -- | |
| 1027 Main Street Rt | $350,000 | -- | |
| Bunker Christopher | -- | -- | |
| Bunker Christopher J | -- | -- |
Source: Public Records
Mortgage History
We collect this data history from publicly available records. To have your information removed, we recommend requesting removal directly through your county’s website.
| Date | Status | Borrower | Loan Amount |
|---|---|---|---|
| Previous Owner | Bunker Christopher | $1,500,000 | |
| Previous Owner | Bunker Christopher | $135,000 | |
| Previous Owner | Bunker Christopher | $65,000 |
Source: Public Records
Tax History
| Year | Tax Paid | Tax Assessment Tax Assessment Total Assessment is a certain percentage of the fair market value that is determined by local assessors to be the total taxable value of land and additions on the property. | Land | Improvement |
|---|---|---|---|---|
| 2025 | $9,222 | $746,700 | $321,900 | $424,800 |
| 2024 | $9,588 | $746,700 | $321,900 | $424,800 |
| 2023 | $9,394 | $696,400 | $292,700 | $403,700 |
| 2022 | $9,830 | $644,600 | $243,900 | $400,700 |
| 2021 | $13,647 | $622,100 | $221,700 | $400,400 |
| 2020 | $5,868 | $359,800 | $221,700 | $138,100 |
| 2019 | $1,490 | $374,900 | $221,700 | $153,200 |
| 2018 | $6,447 | $396,000 | $221,700 | $174,300 |
| 2017 | $1,573 | $381,300 | $227,500 | $153,800 |
| 2016 | $6,754 | $400,600 | $206,900 | $193,700 |
| 2015 | $6,429 | $398,100 | $225,700 | $172,400 |
Source: Public Records
Map
Nearby Homes
- 569 Main St
- 183 Whiting St
- 392 Cedar St
- 11 Duncan Dr
- 9 Douglas Ave
- 15 Leigh Rd
- 239 Washington St Unit 20
- 214 Washington St Unit 28
- 283 Pond St
- 20 Jackson Rd
- 18 W End Way Unit 18W
- 286 Mayflower Cir
- 107 Pond St
- 491 Webster St
- 3 Brattle Rd
- 28 Lantern Ln
- 313 E Water St
- 823 Market St
- 17 Sunnybank Ave
- 10 Sunnybank Ave
Your Personal Tour Guide
Ask me questions while you tour the home.