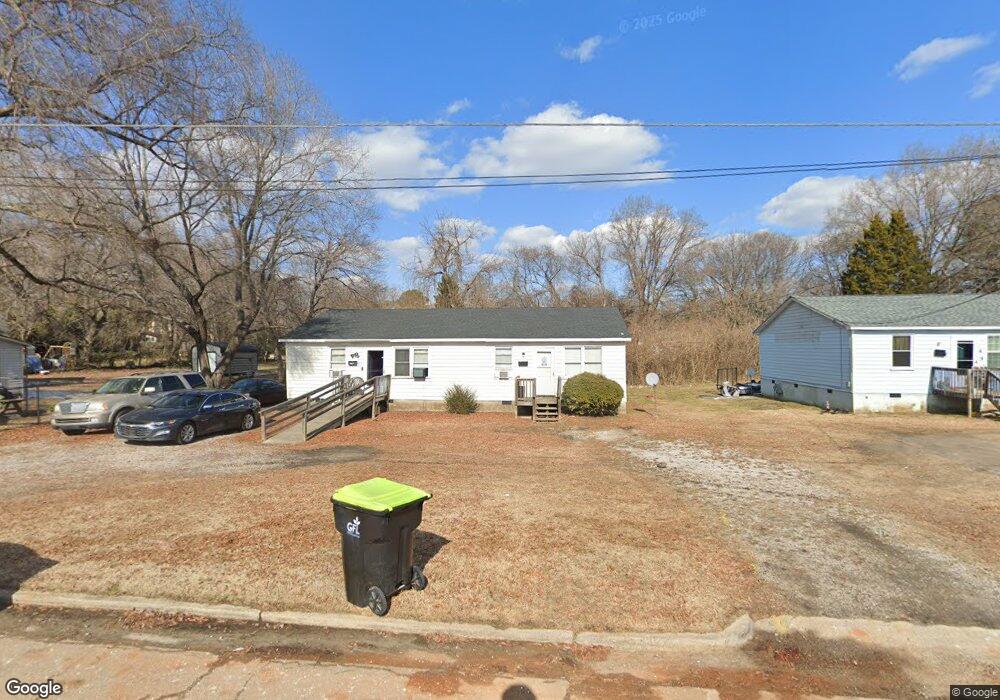
1027 Maple St Unit 1029 Henderson, NC 27536
Estimated Value: $69,000 - $120,000
4
Beds
2
Baths
1,600
Sq Ft
$58/Sq Ft
Est. Value
About This Home
This home is located at 1027 Maple St Unit 1029, Henderson, NC 27536 and is currently estimated at $93,333, approximately $58 per square foot. 1027 Maple St Unit 1029 is a home located in Vance County with nearby schools including L.B. Yancey Elementary School, Henderson Middle School, and Southern Vance High School.
Ownership History
Date
Name
Owned For
Owner Type
Purchase Details
Closed on
Dec 17, 2020
Sold by
Woodlief Ryan H and Woodlief Laura I
Bought by
Carolina Coastal Standard Investments Ll
Current Estimated Value
Home Financials for this Owner
Home Financials are based on the most recent Mortgage that was taken out on this home.
Original Mortgage
$360,000
Outstanding Balance
$320,507
Interest Rate
2.7%
Mortgage Type
Commercial
Estimated Equity
-$227,174
Purchase Details
Closed on
Nov 20, 2017
Sold by
Stamper Rebecca P
Bought by
Woodlief Ryan and Woodlief Laura
Home Financials for this Owner
Home Financials are based on the most recent Mortgage that was taken out on this home.
Original Mortgage
$22,000
Interest Rate
3.85%
Mortgage Type
Seller Take Back
Purchase Details
Closed on
Sep 19, 2011
Sold by
Stamper Robert A and Stamper Rebecca P
Bought by
Abba Stamper Llc
Purchase Details
Closed on
Aug 23, 1994
Bought by
Abba Stamper Llc
Create a Home Valuation Report for This Property
The Home Valuation Report is an in-depth analysis detailing your home's value as well as a comparison with similar homes in the area
Home Values in the Area
Average Home Value in this Area
Purchase History
| Date | Buyer | Sale Price | Title Company |
|---|---|---|---|
| Carolina Coastal Standard Investments Ll | -- | None Available | |
| Woodlief Ryan | $27,000 | None Available | |
| Stamper Rebecca P | -- | None Available | |
| Abba Stamper Llc | -- | -- | |
| Abba Stamper Llc | $74,000 | -- |
Source: Public Records
Mortgage History
| Date | Status | Borrower | Loan Amount |
|---|---|---|---|
| Open | Carolina Coastal Standard Investments Ll | $360,000 | |
| Previous Owner | Woodlief Ryan | $22,000 |
Source: Public Records
Tax History Compared to Growth
Tax History
| Year | Tax Paid | Tax Assessment Tax Assessment Total Assessment is a certain percentage of the fair market value that is determined by local assessors to be the total taxable value of land and additions on the property. | Land | Improvement |
|---|---|---|---|---|
| 2025 | $1,000 | $73,380 | $8,455 | $64,925 |
| 2024 | $1,250 | $73,380 | $8,455 | $64,925 |
| 2023 | $941 | $42,765 | $6,216 | $36,549 |
| 2022 | $925 | $42,765 | $6,216 | $36,549 |
| 2021 | $685 | $42,765 | $6,216 | $36,549 |
| 2020 | $919 | $42,765 | $6,216 | $36,549 |
| 2019 | $909 | $42,765 | $6,216 | $36,549 |
| 2018 | $685 | $42,765 | $6,216 | $36,549 |
| 2017 | $895 | $42,765 | $6,216 | $36,549 |
| 2016 | $895 | $42,765 | $6,216 | $36,549 |
| 2015 | $1,183 | $66,660 | $9,768 | $56,892 |
| 2014 | $1,151 | $66,658 | $9,768 | $56,890 |
Source: Public Records
Map
Nearby Homes
- 903 Nicholas St
- 713 Champion St
- 845 S William St
- 216 Chavasse Ave
- 275 Gholson Ave
- 00 Young Ave
- 500 Zene St
- 533 E Winder St
- 128 Carolina Ave
- 422 Harriett St
- 735 Alexander Ave
- 605 E Montgomery St
- 505 Harriett St
- 714 Harriett St
- 410 E Montgomery St
- 166 W Belle St
- 925 S Chestnut St
- 118 Cherry St
- 830 S Chestnut St
- 1105 S Chestnut St