1027 Mason St Lagrange, GA 30241
Estimated Value: $63,000 - $147,641
3
Beds
2
Baths
1,491
Sq Ft
$75/Sq Ft
Est. Value
About This Home
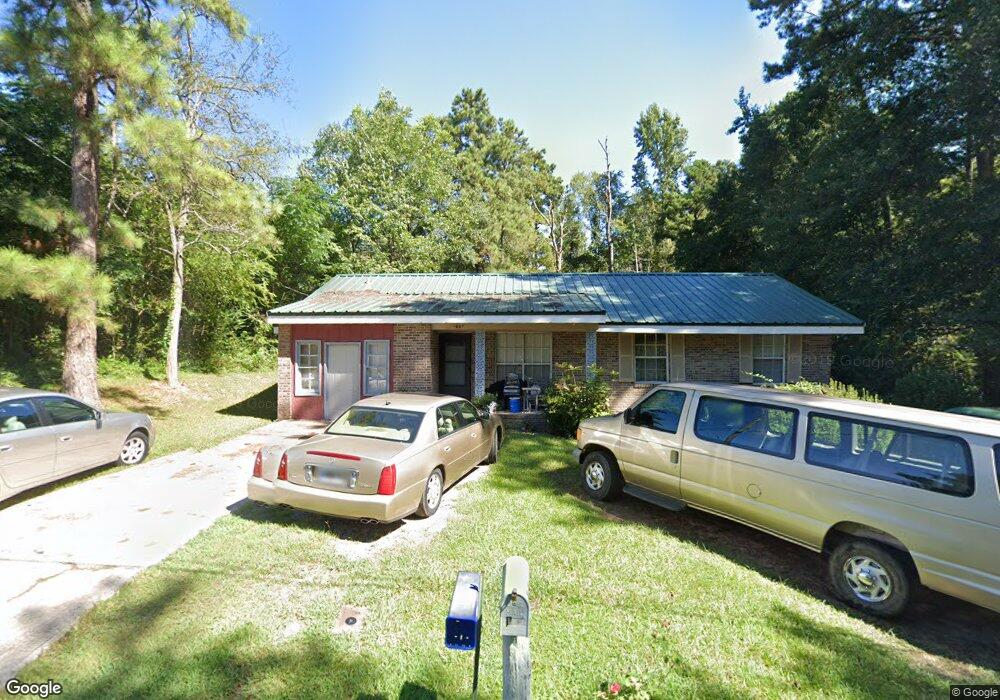
This home is located at 1027 Mason St, Lagrange, GA 30241 and is currently estimated at $112,410, approximately $75 per square foot. 1027 Mason St is a home located in Troup County with nearby schools including Hollis Hand Elementary School, Franklin Forest Elementary School, and Ethel W. Kight Elementary School.
Ownership History
Date
Name
Owned For
Owner Type
Purchase Details
Closed on
Jan 9, 1986
Sold by
Esmond Willoughby
Bought by
Wheat Edward and Wheat Barbara
Current Estimated Value
Purchase Details
Closed on
Jan 12, 1983
Sold by
Veterans Adm
Bought by
Esmond Willoughby
Purchase Details
Closed on
Aug 5, 1981
Sold by
Linda Willie and Linda Magby
Bought by
Veterans Adm
Purchase Details
Closed on
Mar 3, 1977
Sold by
B& F Const
Bought by
Linda Willie and Linda Magby
Purchase Details
Closed on
Dec 1, 1976
Sold by
Security Mutual Fin
Bought by
B& F Const
Purchase Details
Closed on
Jun 3, 1975
Sold by
Willie Harris
Bought by
Security Mutual Fin
Purchase Details
Closed on
Aug 27, 1972
Sold by
Luck Enterprises
Bought by
Willie Harris
Purchase Details
Closed on
Jan 1, 1972
Sold by
Peavy
Bought by
Luck Enterprises
Purchase Details
Closed on
Dec 31, 1968
Sold by
Peavy E H
Bought by
Peavy
Create a Home Valuation Report for This Property
The Home Valuation Report is an in-depth analysis detailing your home's value as well as a comparison with similar homes in the area
Purchase History
| Date | Buyer | Sale Price | Title Company |
|---|---|---|---|
| Wheat Edward | $42,500 | -- | |
| Esmond Willoughby | -- | -- | |
| Veterans Adm | -- | -- | |
| Linda Willie | -- | -- | |
| B& F Const | -- | -- | |
| Security Mutual Fin | -- | -- | |
| Willie Harris | -- | -- | |
| Luck Enterprises | -- | -- | |
| Peavy | -- | -- |
Source: Public Records
Tax History
| Year | Tax Paid | Tax Assessment Tax Assessment Total Assessment is a certain percentage of the fair market value that is determined by local assessors to be the total taxable value of land and additions on the property. | Land | Improvement |
|---|---|---|---|---|
| 2025 | $1,142 | $41,880 | $4,760 | $37,120 |
| 2024 | $793 | $39,040 | $4,760 | $34,280 |
| 2023 | $124 | $32,400 | $4,760 | $27,640 |
| 2022 | $566 | $30,240 | $4,760 | $25,480 |
| 2021 | $528 | $27,440 | $2,680 | $24,760 |
| 2020 | $528 | $27,440 | $2,680 | $24,760 |
| 2019 | $454 | $25,008 | $2,688 | $22,320 |
| 2018 | $470 | $25,520 | $2,688 | $22,832 |
| 2017 | $470 | $25,520 | $2,688 | $22,832 |
| 2016 | $476 | $25,693 | $2,688 | $23,005 |
| 2015 | $478 | $25,693 | $2,688 | $23,005 |
| 2014 | $442 | $24,482 | $2,688 | $21,794 |
| 2013 | -- | $24,621 | $2,688 | $21,933 |
Source: Public Records
Map
Nearby Homes
- 1017 Mason St
- 957 Kelley St
- 428 Macon St
- 0 Kelley St Unit 10550311
- 459 Merrywood Dr
- 626 Smoot St
- 510 Smoot St
- 0 Brown St Unit 10550761
- 0 Brown St Unit 10550754
- 203 Revis St
- 205 Revis St
- 0 Burr St
- 306 Burr St
- 117 Belk St
- LOT 58 Belk St
- 119 Belk St
- LOT 65 Belk St
- LOT 66 Belk St
- 200 Mccall St
- 0 E Render St
Your Personal Tour Guide
Ask me questions while you tour the home.