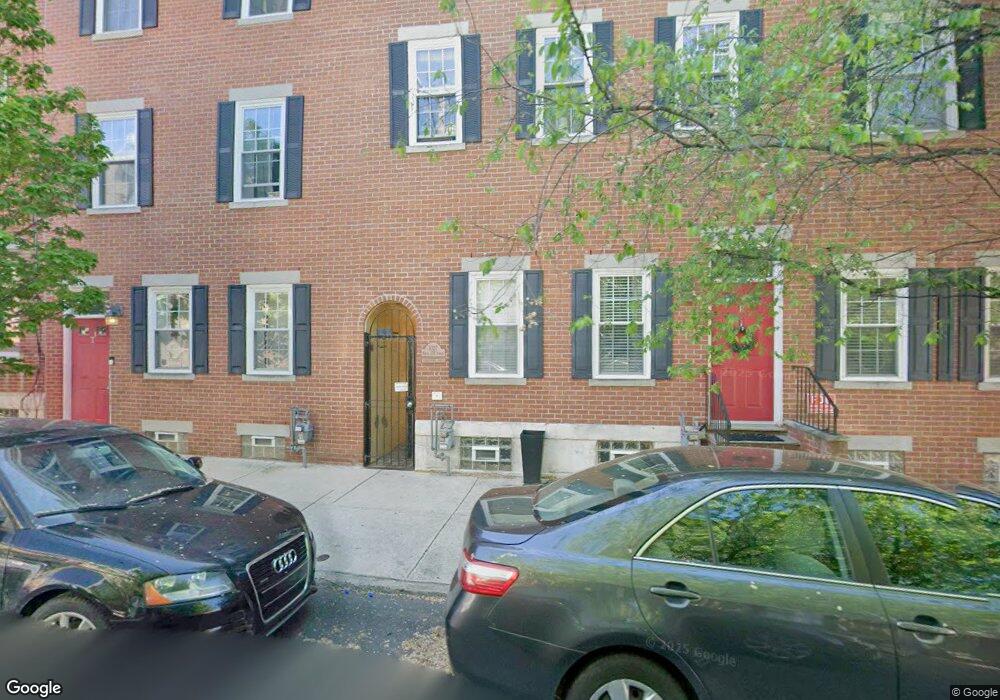
1027 N 4th St Unit P Philadelphia, PA 19123
Northern Liberties NeighborhoodEstimated Value: $185,000 - $274,000
1
Bed
1
Bath
764
Sq Ft
$300/Sq Ft
Est. Value
About This Home
This home is located at 1027 N 4th St Unit P, Philadelphia, PA 19123 and is currently estimated at $229,471, approximately $300 per square foot. 1027 N 4th St Unit P is a home located in Philadelphia County with nearby schools including James R. Ludlow School, Penn Treaty School, and Young Scholars Charter School.
Ownership History
Date
Name
Owned For
Owner Type
Purchase Details
Closed on
May 26, 2017
Sold by
U S Bank Na
Bought by
Aufuery Christine
Current Estimated Value
Purchase Details
Closed on
Dec 5, 2016
Sold by
Getty Mark J and Getty Mark J
Bought by
U S Bank Natiional Association
Purchase Details
Closed on
Aug 18, 2006
Sold by
1027-31 N 4Th Street Lp
Bought by
Getty Mark J
Home Financials for this Owner
Home Financials are based on the most recent Mortgage that was taken out on this home.
Original Mortgage
$189,900
Interest Rate
6.79%
Mortgage Type
Purchase Money Mortgage
Purchase Details
Closed on
Jun 2, 2006
Sold by
1027-31 North 4Th Street Lp
Bought by
Hillmon Reginald
Home Financials for this Owner
Home Financials are based on the most recent Mortgage that was taken out on this home.
Original Mortgage
$224,910
Interest Rate
6.25%
Mortgage Type
New Conventional
Purchase Details
Closed on
Jun 19, 2000
Sold by
Cobblestone Court Inc
Bought by
Sandia Partnership
Create a Home Valuation Report for This Property
The Home Valuation Report is an in-depth analysis detailing your home's value as well as a comparison with similar homes in the area
Home Values in the Area
Average Home Value in this Area
Purchase History
| Date | Buyer | Sale Price | Title Company |
|---|---|---|---|
| Aufuery Christine | $126,000 | None Available | |
| U S Bank Natiional Association | $125,000 | None Available | |
| Getty Mark J | $199,900 | None Available | |
| Hillmon Reginald | $249,900 | None Available | |
| Sandia Partnership | $13,100 | -- |
Source: Public Records
Mortgage History
| Date | Status | Borrower | Loan Amount |
|---|---|---|---|
| Previous Owner | Getty Mark J | $189,900 | |
| Previous Owner | Hillmon Reginald | $224,910 |
Source: Public Records
Tax History Compared to Growth
Tax History
| Year | Tax Paid | Tax Assessment Tax Assessment Total Assessment is a certain percentage of the fair market value that is determined by local assessors to be the total taxable value of land and additions on the property. | Land | Improvement |
|---|---|---|---|---|
| 2026 | $2,972 | $222,900 | $35,700 | $187,200 |
| 2025 | $2,972 | $222,900 | $35,700 | $187,200 |
| 2024 | $2,972 | $222,900 | $35,700 | $187,200 |
| 2023 | $2,972 | $212,300 | $34,000 | $178,300 |
| 2022 | $2,476 | $212,300 | $34,000 | $178,300 |
| 2021 | $2,476 | $0 | $0 | $0 |
| 2020 | $2,476 | $0 | $0 | $0 |
| 2019 | $2,476 | $0 | $0 | $0 |
| 2018 | $2,476 | $0 | $0 | $0 |
| 2017 | $415 | $0 | $0 | $0 |
| 2016 | $268 | $0 | $0 | $0 |
| 2015 | $257 | $0 | $0 | $0 |
| 2014 | -- | $176,900 | $17,690 | $159,210 |
| 2012 | -- | $39,456 | $7,904 | $31,552 |
Source: Public Records
Map
Nearby Homes
- 1027 31 N 4th St Unit K
- 963 N Lawrence St
- 949 N Orianna St
- 1007 N 3rd St Unit D
- 1005 N 3rd St Unit C
- 1136 N 4th St
- 1030 N Leithgow St
- 1102 N Bodine St
- 1138 N 4th St
- 1130 N 3rd St
- 1146 N Orianna St
- 934-50 N 3rd St Unit 310
- 934-50 N 3rd St Unit 205
- 961 N 5th St
- 957 N 5th St
- 1146 N Galloway St
- 1146 N 3rd St
- 1147 53 N 4th St Unit 6E
- 1147 53 N 4th St Unit 5C
- 1147 N 4th St Unit 6F
- 1027 N 4th St
- 1027 N 4th St Unit M
- 1027 N 4th St Unit N
- 1027 N 4th St Unit K
- 1027 N 4th St Unit H
- 1027 N 4th St Unit G
- 1027 N 4th St Unit I
- 1027 N 4th St Unit S
- 1027 N 4th St Unit L
- 1027 N 4th St Unit J
- 1027 N 4th St Unit E
- 1027 N 4th St Unit G
- 1027 N 4th St Unit H
- 1027 N 4th St Unit F
- 1027 N 4th St Unit U
- 1027 N 4th St Unit I
- 1027 N 4th St Unit W
- 1027 N 4th St Unit U
- 1027 N 4th St Unit A
- 1027 N 4th St Unit O