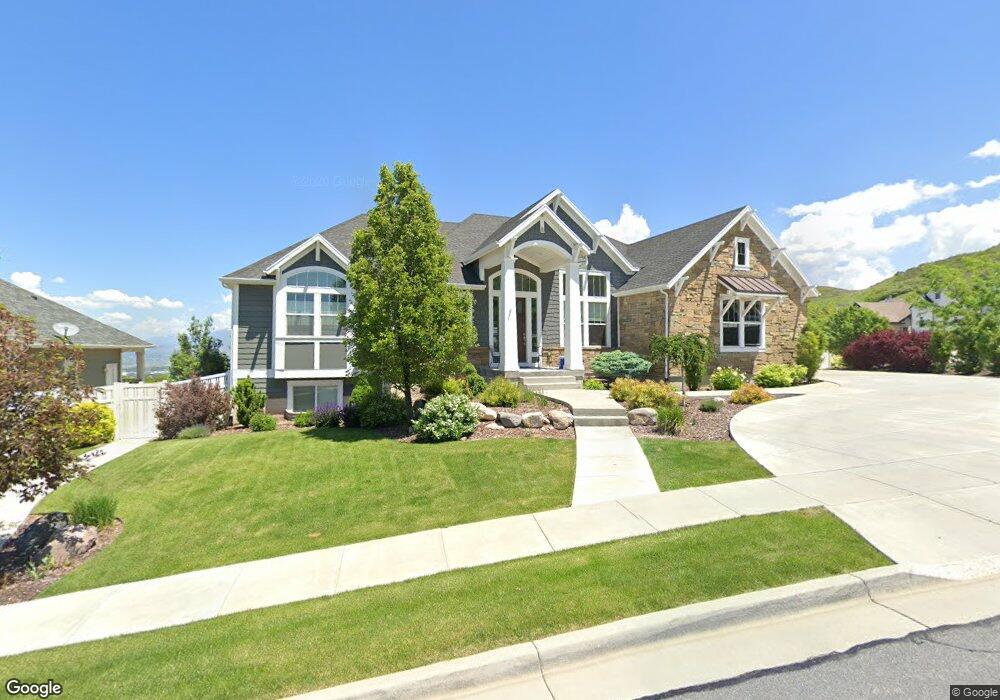
1027 Parkway Dr North Salt Lake, UT 84054
Estimated Value: $1,134,000 - $1,370,000
4
Beds
4
Baths
5,013
Sq Ft
$252/Sq Ft
Est. Value
About This Home
This home is located at 1027 Parkway Dr, North Salt Lake, UT 84054 and is currently estimated at $1,264,862, approximately $252 per square foot. 1027 Parkway Dr is a home located in Davis County with nearby schools including Orchard School, South Davis Junior High School, and Woods Cross High School.
Ownership History
Date
Name
Owned For
Owner Type
Purchase Details
Closed on
Jul 19, 2012
Sold by
Holdaway Damon
Bought by
Holdaway Damon and Holdaway Debra B
Current Estimated Value
Home Financials for this Owner
Home Financials are based on the most recent Mortgage that was taken out on this home.
Original Mortgage
$416,812
Outstanding Balance
$287,174
Interest Rate
3.63%
Mortgage Type
New Conventional
Estimated Equity
$977,688
Purchase Details
Closed on
Nov 16, 2011
Sold by
Crestpointe Investment L L C
Bought by
Rainey Homes Inc
Home Financials for this Owner
Home Financials are based on the most recent Mortgage that was taken out on this home.
Original Mortgage
$325,000
Interest Rate
4.06%
Mortgage Type
Construction
Create a Home Valuation Report for This Property
The Home Valuation Report is an in-depth analysis detailing your home's value as well as a comparison with similar homes in the area
Home Values in the Area
Average Home Value in this Area
Purchase History
| Date | Buyer | Sale Price | Title Company |
|---|---|---|---|
| Holdaway Damon | -- | Bonneville Superior | |
| Holdaway Damon | -- | Bonneville Superior | |
| Rainey Homes Inc | -- | First American Title |
Source: Public Records
Mortgage History
| Date | Status | Borrower | Loan Amount |
|---|---|---|---|
| Open | Holdaway Damon | $416,812 | |
| Closed | Holdaway Damon | $138,938 | |
| Previous Owner | Rainey Homes Inc | $325,000 | |
| Previous Owner | Rainey Homes Inc | $325,000 |
Source: Public Records
Tax History Compared to Growth
Tax History
| Year | Tax Paid | Tax Assessment Tax Assessment Total Assessment is a certain percentage of the fair market value that is determined by local assessors to be the total taxable value of land and additions on the property. | Land | Improvement |
|---|---|---|---|---|
| 2025 | $5,632 | $600,600 | $204,401 | $396,199 |
| 2024 | $5,632 | $566,500 | $216,960 | $349,540 |
| 2023 | $5,631 | $1,024,000 | $283,954 | $740,046 |
| 2022 | $5,642 | $563,200 | $157,694 | $405,506 |
| 2021 | $5,565 | $843,000 | $236,204 | $606,796 |
| 2020 | $4,959 | $743,000 | $202,407 | $540,593 |
| 2019 | $5,036 | $736,000 | $195,953 | $540,047 |
| 2018 | $4,711 | $681,000 | $176,384 | $504,616 |
| 2016 | $4,480 | $344,410 | $97,291 | $247,119 |
| 2015 | $4,714 | $348,150 | $97,291 | $250,859 |
| 2014 | $5,474 | $412,090 | $97,291 | $314,799 |
| 2013 | -- | $351,889 | $68,761 | $283,128 |
Source: Public Records
Map
Nearby Homes
- 928 S Pace Place
- 985 Plum Tree Ct Unit 1
- 1045 Plum Tree Ct Unit 4B
- 755 Parkway Dr
- 871 S Winter Ln
- 733 Eagle Pass
- 837 S Finley Cir
- 311 Edgemont Dr
- 715 S Miller Ave
- 460 S Sunset Ridge Dr
- 398 Lofty Ln
- 271 E Eagle Ridge Dr
- 285 Constitution Way
- 720 Freedom Cir
- 151 S Bernice Way
- 520 Lacey Way
- 585 Marialana Way
- 275 Eagle Way
- 566 S Tanglewood Loop Unit 1327
- 565 S Tanglewood Loop Unit 1325
- 1025 Parkway Dr
- 1025 Parkway Dr Unit 1506
- 1030 Parkway Dr Unit 1511
- 1015 Eaglepointe Dr Unit 1508
- 1015 Eaglepointe Dr Unit 1508
- 1015 Eaglepointe Dr
- 1029 Eaglepointe Dr Unit 1509
- 1029 Eaglepointe Dr Unit 1509
- 1001 Eaglepointe Dr Unit 1219
- 1015 Eaglepointe Dr
- 1022 Parkway Dr
- 1021 Parkway Dr
- 1021 Parkway Dr Unit 1505
- 1041 Eaglepointe Dr
- 989 Eaglepointe Dr Unit 1218
- 1018 Parkway Dr Unit 1513
- 1017 Parkway Dr Unit 1504
- 975 Eaglepointe Dr
- 1014 Parkway Dr Unit 1514
- 953 Eaglepointe Dr