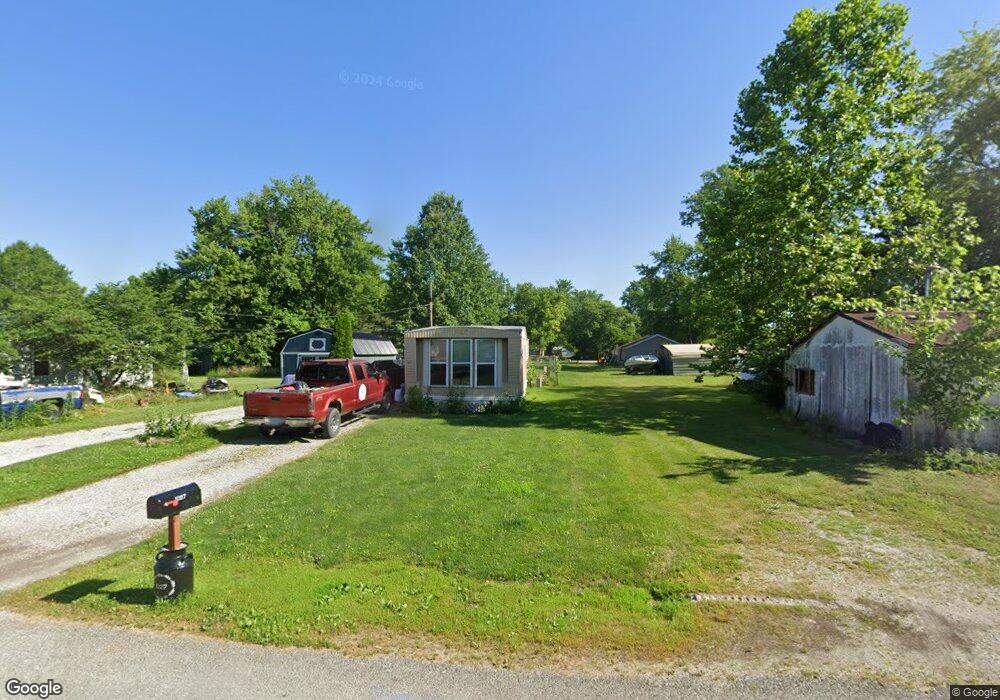
1027 Seneca St Litchfield, IL 62056
Estimated Value: $57,471 - $106,000
--
Bed
--
Bath
840
Sq Ft
$106/Sq Ft
Est. Value
About This Home
This home is located at 1027 Seneca St, Litchfield, IL 62056 and is currently estimated at $89,118, approximately $106 per square foot. 1027 Seneca St is a home located in Montgomery County with nearby schools including J.D. Colt Elementary School, Madison Park Elementary School, and Litchfield Elementary School.
Ownership History
Date
Name
Owned For
Owner Type
Purchase Details
Closed on
Jan 31, 2024
Sold by
Simpson Kimberly K
Bought by
Rhodes Meghan A
Current Estimated Value
Purchase Details
Closed on
Sep 5, 2018
Sold by
Thompson Nicole S
Bought by
Simpson Kimberly K
Purchase Details
Closed on
May 3, 2007
Sold by
Werner Janet and Werner Norma
Bought by
Hicks Nicole S
Home Financials for this Owner
Home Financials are based on the most recent Mortgage that was taken out on this home.
Original Mortgage
$10,000
Interest Rate
6.2%
Mortgage Type
New Conventional
Create a Home Valuation Report for This Property
The Home Valuation Report is an in-depth analysis detailing your home's value as well as a comparison with similar homes in the area
Home Values in the Area
Average Home Value in this Area
Purchase History
| Date | Buyer | Sale Price | Title Company |
|---|---|---|---|
| Rhodes Meghan A | $8,000 | Community Title | |
| Simpson Kimberly K | $5,000 | None Available | |
| Hicks Nicole S | $9,000 | None Available |
Source: Public Records
Mortgage History
| Date | Status | Borrower | Loan Amount |
|---|---|---|---|
| Previous Owner | Hicks Nicole S | $10,000 |
Source: Public Records
Tax History Compared to Growth
Tax History
| Year | Tax Paid | Tax Assessment Tax Assessment Total Assessment is a certain percentage of the fair market value that is determined by local assessors to be the total taxable value of land and additions on the property. | Land | Improvement |
|---|---|---|---|---|
| 2024 | $636 | $13,120 | $740 | $12,380 |
| 2023 | $569 | $12,230 | $690 | $11,540 |
| 2022 | $501 | $11,380 | $640 | $10,740 |
| 2021 | $427 | $10,490 | $590 | $9,900 |
| 2020 | $385 | $10,070 | $570 | $9,500 |
| 2019 | $376 | $9,860 | $560 | $9,300 |
| 2018 | $462 | $10,640 | $600 | $10,040 |
| 2017 | $438 | $10,350 | $580 | $9,770 |
| 2016 | $429 | $10,220 | $570 | $9,650 |
| 2015 | $419 | $10,220 | $570 | $9,650 |
| 2013 | $400 | $10,150 | $560 | $9,590 |
Source: Public Records
Map
Nearby Homes
- 1000 S Illinois Ave
- 817 S Montgomery Ave
- 836 S Chestnut St
- 821 S Chestnut St
- 227 S Montgomery Ave
- TBD S State St
- 204 E Columbia St
- 822 E Union Ave
- 227 W Water St
- 604 N Illinois Ave
- 709 S Jefferson St
- 620 N Chestnut St
- 419 E Corwin St
- 713 S Jackson St
- 413 E Beach St
- 704 N Monroe St
- 1957 E Union Ave
- 1961 E Union Ave
- 211 E Beach St
- 305 E Hauser St
- 1023 Seneca St
- 1013 Mckinley Ave
- 1009 Mckinley Ave
- 1009 Mckinley Ave
- 1019 Seneca St
- 1030 E Jones St
- 1028 E Jones St
- 1024 Seneca St
- 1026 Seneca St
- 1101 Mckinley Ave
- 1022 Seneca St
- 1020 Seneca St
- 1030 S Illinois Ave
- 1013 E Jones St
- 1107 Mckinley Ave
- 1204 S Illinois Ave
- 1204 S Illinois Ave
- 913 Mckinley Ave
- 1011 E Jones St
- 1004 S Illinois Ave