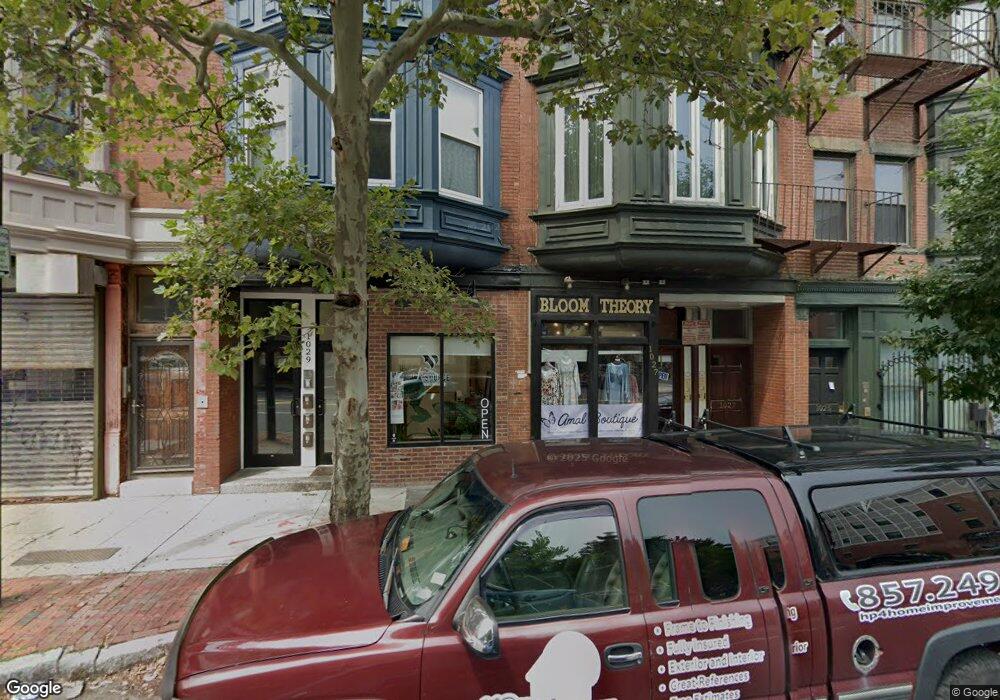
1027 Tremont St Unit 1029 Roxbury Crossing, MA 02120
Lower Roxbury NeighborhoodEstimated Value: $2,654,651
--
Bed
--
Bath
2,508
Sq Ft
$1,058/Sq Ft
Est. Value
About This Home
This home is located at 1027 Tremont St Unit 1029, Roxbury Crossing, MA 02120 and is currently estimated at $2,654,651, approximately $1,058 per square foot. 1027 Tremont St Unit 1029 is a home located in Suffolk County with nearby schools including Paige Academy.
Ownership History
Date
Name
Owned For
Owner Type
Purchase Details
Closed on
Jul 16, 2015
Sold by
1027 Tremont Street Ll
Bought by
1027 Tremont St Boston
Current Estimated Value
Home Financials for this Owner
Home Financials are based on the most recent Mortgage that was taken out on this home.
Original Mortgage
$975,000
Outstanding Balance
$760,778
Interest Rate
3.88%
Mortgage Type
Commercial
Estimated Equity
$1,893,873
Purchase Details
Closed on
Nov 15, 2013
Sold by
1027 Llc
Bought by
1027 Tremont Street Ll
Home Financials for this Owner
Home Financials are based on the most recent Mortgage that was taken out on this home.
Original Mortgage
$840,000
Interest Rate
4.24%
Mortgage Type
Commercial
Purchase Details
Closed on
Nov 9, 2010
Sold by
Izedian Ramesh
Bought by
1027 Llc
Create a Home Valuation Report for This Property
The Home Valuation Report is an in-depth analysis detailing your home's value as well as a comparison with similar homes in the area
Home Values in the Area
Average Home Value in this Area
Purchase History
| Date | Buyer | Sale Price | Title Company |
|---|---|---|---|
| 1027 Tremont St Boston | $1,350,000 | -- | |
| 1027 Tremont Street Ll | $1,200,000 | -- | |
| 1027 Llc | -- | -- |
Source: Public Records
Mortgage History
| Date | Status | Borrower | Loan Amount |
|---|---|---|---|
| Open | 1027 Tremont St Boston | $975,000 | |
| Previous Owner | 1027 Tremont Street Ll | $840,000 |
Source: Public Records
Tax History Compared to Growth
Tax History
| Year | Tax Paid | Tax Assessment Tax Assessment Total Assessment is a certain percentage of the fair market value that is determined by local assessors to be the total taxable value of land and additions on the property. | Land | Improvement |
|---|---|---|---|---|
| 2025 | -- | $1,267,900 | $376,700 | $891,200 |
| 2024 | -- | $1,278,400 | $376,700 | $901,700 |
| 2023 | $0 | $1,300,600 | $376,700 | $923,900 |
| 2022 | $0 | $1,255,100 | $376,700 | $878,400 |
| 2021 | $0 | $1,277,600 | $328,400 | $949,200 |
| 2020 | $0 | $1,255,000 | $328,400 | $926,600 |
| 2019 | $0 | $1,222,000 | $328,400 | $893,600 |
| 2018 | $0 | $1,161,000 | $312,200 | $848,800 |
| 2017 | $0 | $1,109,000 | $297,700 | $811,300 |
| 2016 | -- | $1,010,000 | $275,000 | $735,000 |
| 2015 | -- | $861,000 | $180,000 | $681,000 |
| 2014 | -- | $693,500 | $151,300 | $542,200 |
Source: Public Records
Map
Nearby Homes
- 1011 Tremont St
- 41 Greenwich St
- 239 Northampton St
- 263-265 Northampton St Unit 206
- 531 Massachusetts Ave Unit 1
- 483 Massachusetts Ave Unit 7
- 455 Massachusetts Ave Unit 1
- 451-453 Massachusetts Ave Unit 8
- 771 Tremont St Unit 2
- 460 Massachusetts Ave Unit B
- 530 Massachusetts Ave Unit 2
- 1950 Washington St Unit 5C
- 32 Williams St Unit 1
- 577 Massachusetts Ave Unit PH
- 577 Massachusetts Ave Unit C
- 583 Massachusetts Ave Unit 5
- 566 Columbus Ave Unit 614
- 270 Huntington Ave Unit 304
- 203 W Springfield St Unit 1
- 211 W Springfield St
- 1027-1029 Tremont St
- 1029 Tremont St Unit 1029 Tremont St 3
- 1029 Tremont St Unit 103
- 1029 Tremont St Unit 106
- 1029-3 Tremont St Unit 1029
- 1029 Tremont St Unit Tremont
- 1027 Tremont St
- 1029 Tremont St
- 1029 Tremont St Unit 1
- 1029 Tremont St Unit 3
- 1029 Tremont St
- 1027 Tremont St
- 1029 Tremont St Unit 2
- 1027 Tremont St Unit 3
- 1027 Tremont St Unit 2
- 1027 Tremont St Unit 1
- 1029 1/2 Tremont St
- 1023 Tremont St Unit 1025
- 1025 Tremont St Unit 106
- 1025 Tremont St Unit 4