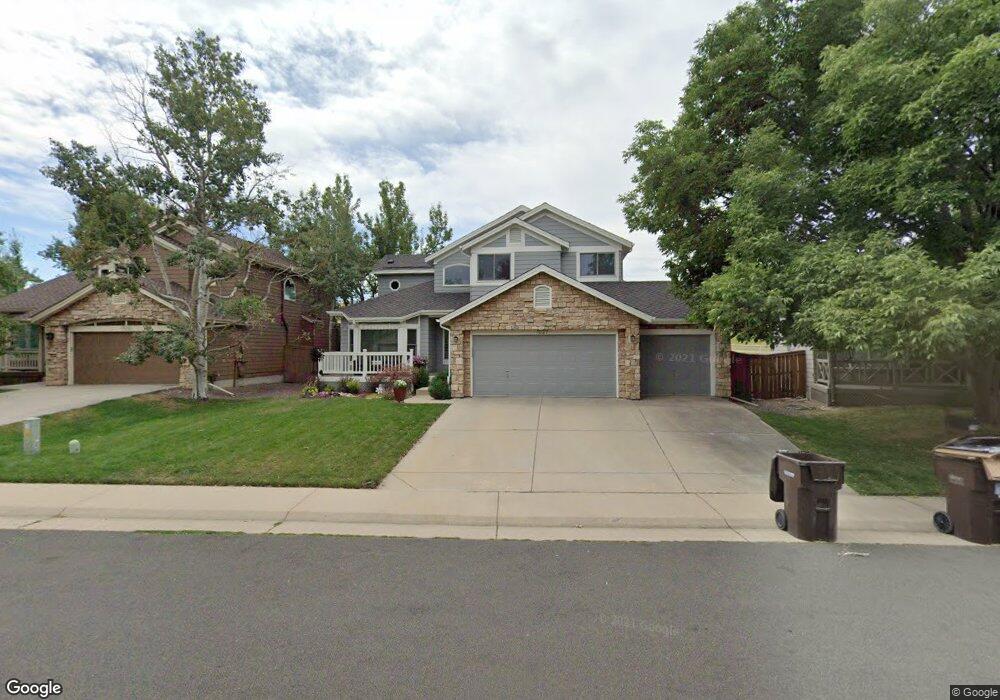
1027 Turnberry Cir Louisville, CO 80027
Estimated Value: $1,100,000 - $1,536,000
6
Beds
4
Baths
3,379
Sq Ft
$377/Sq Ft
Est. Value
About This Home
This home is located at 1027 Turnberry Cir, Louisville, CO 80027 and is currently estimated at $1,273,607, approximately $376 per square foot. 1027 Turnberry Cir is a home located in Boulder County with nearby schools including Monarch K-8 School, Monarch High School, and St. Louis Catholic School.
Ownership History
Date
Name
Owned For
Owner Type
Purchase Details
Closed on
Jun 1, 2011
Sold by
Bryant Ross and Bryant Andrea
Bought by
Hymes Jacob S
Current Estimated Value
Home Financials for this Owner
Home Financials are based on the most recent Mortgage that was taken out on this home.
Original Mortgage
$364,110
Outstanding Balance
$253,586
Interest Rate
4.85%
Mortgage Type
New Conventional
Estimated Equity
$1,020,021
Purchase Details
Closed on
Oct 31, 2006
Sold by
Ricks Jimmy Louis and Ricks Kimberly Kay
Bought by
Bryant Ross
Home Financials for this Owner
Home Financials are based on the most recent Mortgage that was taken out on this home.
Original Mortgage
$367,920
Interest Rate
6.28%
Mortgage Type
New Conventional
Purchase Details
Closed on
Apr 4, 1991
Bought by
Hymes Jacob S and Hymes Lisa C
Purchase Details
Closed on
Dec 5, 1990
Bought by
Hymes Jacob S and Hymes Lisa C
Purchase Details
Closed on
Sep 6, 1990
Bought by
Hymes Jacob S and Hymes Lisa C
Purchase Details
Closed on
Apr 13, 1990
Bought by
Hymes Jacob S and Hymes Lisa C
Create a Home Valuation Report for This Property
The Home Valuation Report is an in-depth analysis detailing your home's value as well as a comparison with similar homes in the area
Home Values in the Area
Average Home Value in this Area
Purchase History
| Date | Buyer | Sale Price | Title Company |
|---|---|---|---|
| Hymes Jacob S | $487,900 | Guardian Title | |
| Bryant Ross | $459,900 | None Available | |
| Hymes Jacob S | $181,800 | -- | |
| Hymes Jacob S | $215,000 | -- | |
| Hymes Jacob S | $156,000 | -- | |
| Hymes Jacob S | -- | -- |
Source: Public Records
Mortgage History
| Date | Status | Borrower | Loan Amount |
|---|---|---|---|
| Open | Hymes Jacob S | $364,110 | |
| Previous Owner | Bryant Ross | $367,920 |
Source: Public Records
Tax History Compared to Growth
Tax History
| Year | Tax Paid | Tax Assessment Tax Assessment Total Assessment is a certain percentage of the fair market value that is determined by local assessors to be the total taxable value of land and additions on the property. | Land | Improvement |
|---|---|---|---|---|
| 2025 | $1,761 | $96,194 | $31,025 | $65,169 |
| 2024 | $1,761 | $96,194 | $31,025 | $65,169 |
| 2023 | $1,731 | $19,591 | $23,276 | -- |
| 2022 | $1,176 | $12,222 | $12,222 | $0 |
| 2021 | $5,492 | $59,295 | $25,147 | $34,148 |
| 2020 | $4,913 | $52,496 | $21,808 | $30,688 |
| 2019 | $4,843 | $52,496 | $21,808 | $30,688 |
| 2018 | $4,511 | $50,494 | $14,112 | $36,382 |
| 2017 | $4,421 | $55,824 | $15,602 | $40,222 |
| 2016 | $4,134 | $46,988 | $15,602 | $31,386 |
| 2015 | $3,918 | $41,432 | $12,418 | $29,014 |
| 2014 | $3,542 | $41,432 | $12,418 | $29,014 |
Source: Public Records
Map
Nearby Homes
- 1030 Turnberry Cir
- 1002 Turnberry Cir
- 941 Saint Andrews Ln
- 941 Saint Andrews Ln Unit 96
- 461 Muirfield Cir
- 945 Saint Andrews Ln
- 945 Saint Andrews Ln Unit 98
- 494 Muirfield Cir
- 953 Saint Andrews Ln
- 497 Muirfield Cir
- 499 Muirfield Cir
- 481 Muirfield Ct
- 2578 Emiline Way
- 977 Saint Andrews Ln
- 830 Josephine Way
- 860 Josephine Way
- The 149 Plan at Downtown Superior - Townhomes
- The 143 Plan at Downtown Superior - Townhomes
- The 502 Plan at Downtown Superior - Single Family Homes
- The 139 Plan at Downtown Superior - Townhomes
- 1025 Turnberry Cir
- 1029 Turnberry Cir
- 1023 Turnberry Cir
- 1024 Turnberry Cir
- 1026 Turnberry Cir
- 1033 Turnberry Cir
- 1021 Turnberry Cir
- 1028 Turnberry Cir
- 1006 Turnberry Cir
- 1035 Turnberry Cir
- 1004 Turnberry Cir
- 1019 Turnberry Cir
- 1032 Turnberry Cir
- 1037 Turnberry Cir
- 1000 Turnberry Cir
- 1009 Turnberry Cir
- 1017 Turnberry Cir
- 1011 Turnberry Cir
- 1007 Turnberry Cir
- 1039 Turnberry Cir