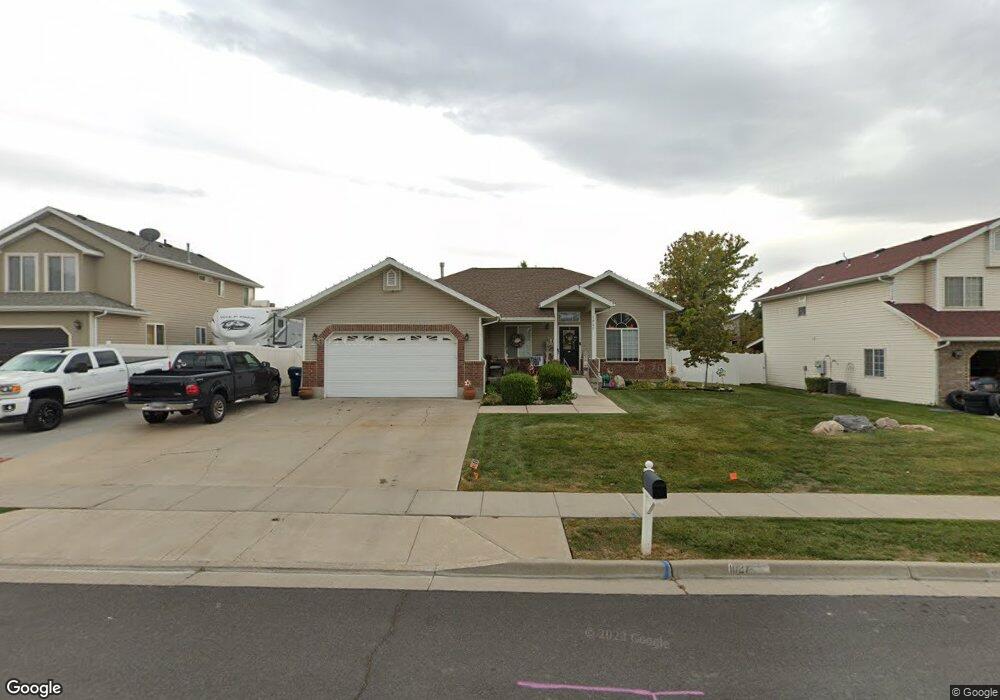
1027 W 1300 S Woods Cross, UT 84087
Estimated Value: $507,000 - $572,000
5
Beds
3
Baths
2,720
Sq Ft
$198/Sq Ft
Est. Value
About This Home
This home is located at 1027 W 1300 S, Woods Cross, UT 84087 and is currently estimated at $538,149, approximately $197 per square foot. 1027 W 1300 S is a home located in Davis County with nearby schools including Woods Cross Elementary School, Millcreek Junior High School, and Woods Cross High School.
Ownership History
Date
Name
Owned For
Owner Type
Purchase Details
Closed on
Feb 25, 2016
Sold by
Johnson Ginger Annette and Lee Tamara Michele
Bought by
Johnson Michael W and Johnson Ginger A
Current Estimated Value
Purchase Details
Closed on
Feb 24, 2016
Sold by
Johnson Michael W
Bought by
Johnson Michael W and Johnson Ginger A
Purchase Details
Closed on
Mar 31, 2010
Sold by
Lancaster Marlin and Lancaster Angela Z
Bought by
Johnson Michael W and Welsh Clara D
Home Financials for this Owner
Home Financials are based on the most recent Mortgage that was taken out on this home.
Original Mortgage
$231,725
Interest Rate
5.5%
Mortgage Type
FHA
Purchase Details
Closed on
May 1, 1997
Sold by
Squires Phil and Squires Barbara
Bought by
Lancaster Marlin and Lancaster Angela Z
Home Financials for this Owner
Home Financials are based on the most recent Mortgage that was taken out on this home.
Original Mortgage
$16,000
Interest Rate
8.08%
Mortgage Type
Seller Take Back
Create a Home Valuation Report for This Property
The Home Valuation Report is an in-depth analysis detailing your home's value as well as a comparison with similar homes in the area
Home Values in the Area
Average Home Value in this Area
Purchase History
| Date | Buyer | Sale Price | Title Company |
|---|---|---|---|
| Johnson Michael W | -- | Pinnacle Title | |
| Johnson Michael W | -- | Pinnacle Title | |
| Johnson Michael W | -- | Bonneville Superior Title Co | |
| Lancaster Marlin | -- | Western States Title Company |
Source: Public Records
Mortgage History
| Date | Status | Borrower | Loan Amount |
|---|---|---|---|
| Previous Owner | Johnson Michael W | $231,725 | |
| Previous Owner | Lancaster Marlin | $16,000 |
Source: Public Records
Tax History Compared to Growth
Tax History
| Year | Tax Paid | Tax Assessment Tax Assessment Total Assessment is a certain percentage of the fair market value that is determined by local assessors to be the total taxable value of land and additions on the property. | Land | Improvement |
|---|---|---|---|---|
| 2025 | $3,148 | $273,350 | $111,695 | $161,655 |
| 2024 | $2,961 | $262,350 | $119,087 | $143,263 |
| 2023 | $2,804 | $461,000 | $157,761 | $303,239 |
| 2022 | $2,896 | $265,100 | $68,565 | $196,535 |
| 2021 | $2,522 | $366,000 | $100,609 | $265,391 |
| 2020 | $2,246 | $322,000 | $95,759 | $226,241 |
| 2019 | $2,212 | $312,000 | $89,365 | $222,635 |
| 2018 | $2,065 | $288,000 | $87,881 | $200,119 |
| 2016 | $1,785 | $136,070 | $37,474 | $98,596 |
| 2015 | $1,749 | $128,425 | $37,474 | $90,951 |
| 2014 | $1,781 | $134,363 | $37,474 | $96,889 |
| 2013 | -- | $119,109 | $28,430 | $90,679 |
Source: Public Records
Map
Nearby Homes
- 1137 S 1050 W
- 1069 W Linden Ln Unit 31
- 1056 W Audrey Ln Unit 14
- 1623 S 925 W
- 1064 W Audrey Ln Unit 15
- 1552 S 850 W
- 1072 W Audrey Ln Unit 17
- 1321 S 840 W
- 1067 W Audrey Ln Unit 8
- 1075 W Audrey Ln Unit 6
- Swiss 2 - Urban Plan at The Audrey - theAUDREY
- Swiss 3 - Urban Plan at The Audrey - theAUDREY
- Swiss 1 - Cottage Plan at The Audrey - theAUDREY
- Swiss 4 - Cottage Plan at The Audrey - theAUDREY
- Swiss 2 - Cottage Plan at The Audrey - theAUDREY
- Swiss 3 - Cottage Plan at The Audrey - theAUDREY
- Swiss 4 - Urban Plan at The Audrey - theAUDREY
- Swiss 1 - Urban Plan at The Audrey - theAUDREY
- 1309 W 1200 S
- 1334 W 1300 S