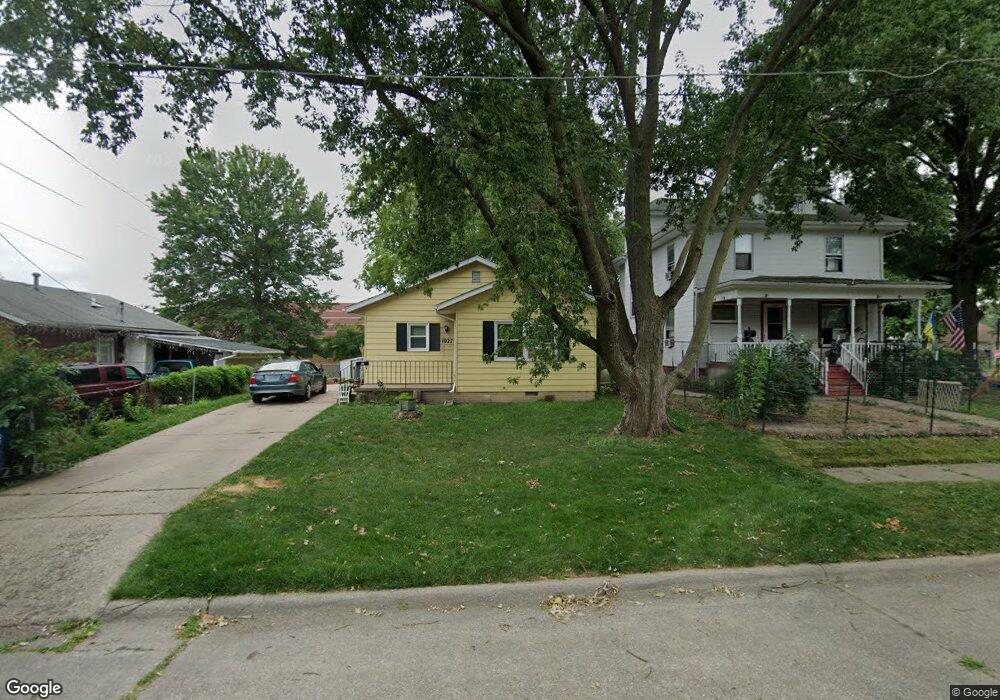
1027 W 13th St Davenport, IL 52804
Central Davenport NeighborhoodEstimated Value: $99,000 - $126,057
3
Beds
1
Bath
964
Sq Ft
$116/Sq Ft
Est. Value
About This Home
This home is located at 1027 W 13th St, Davenport, IL 52804 and is currently estimated at $112,264, approximately $116 per square foot. 1027 W 13th St is a home located in Scott County with nearby schools including Walnut Hill Elementary School, Christian County Middle School, and Casey County Middle School.
Ownership History
Date
Name
Owned For
Owner Type
Purchase Details
Closed on
Oct 20, 2022
Sold by
Nava Luis G
Bought by
Humility Homes & Services Inc
Current Estimated Value
Purchase Details
Closed on
Aug 30, 2013
Sold by
Wallace Trista R and Wallace Nathan
Bought by
Nava Luis G
Home Financials for this Owner
Home Financials are based on the most recent Mortgage that was taken out on this home.
Original Mortgage
$59,401
Interest Rate
4.29%
Mortgage Type
FHA
Purchase Details
Closed on
Feb 25, 2005
Sold by
Gosch William and Gosch Arlyss P
Bought by
Wallace Trista R and Wallace Nathan
Home Financials for this Owner
Home Financials are based on the most recent Mortgage that was taken out on this home.
Original Mortgage
$56,000
Interest Rate
5.7%
Mortgage Type
New Conventional
Create a Home Valuation Report for This Property
The Home Valuation Report is an in-depth analysis detailing your home's value as well as a comparison with similar homes in the area
Home Values in the Area
Average Home Value in this Area
Purchase History
| Date | Buyer | Sale Price | Title Company |
|---|---|---|---|
| Humility Homes & Services Inc | $85,000 | None Listed On Document | |
| Nava Luis G | $60,500 | None Available | |
| Wallace Trista R | $56,000 | None Available |
Source: Public Records
Mortgage History
| Date | Status | Borrower | Loan Amount |
|---|---|---|---|
| Previous Owner | Nava Luis G | $59,401 | |
| Previous Owner | Wallace Trista R | $56,000 |
Source: Public Records
Tax History Compared to Growth
Tax History
| Year | Tax Paid | Tax Assessment Tax Assessment Total Assessment is a certain percentage of the fair market value that is determined by local assessors to be the total taxable value of land and additions on the property. | Land | Improvement |
|---|---|---|---|---|
| 2025 | -- | $97,220 | $16,250 | $80,970 |
| 2024 | -- | $89,120 | $0 | $0 |
| 2023 | $1,366 | $89,120 | $0 | $0 |
| 2022 | $1,308 | $72,830 | $8,000 | $64,830 |
| 2021 | $1,308 | $69,890 | $8,000 | $61,890 |
| 2020 | $1,198 | $63,990 | $8,000 | $55,990 |
| 2019 | $1,178 | $61,050 | $8,000 | $53,050 |
| 2018 | $1,150 | $61,050 | $8,000 | $53,050 |
| 2017 | $1,194 | $61,050 | $8,000 | $53,050 |
| 2016 | $1,146 | $61,050 | $0 | $0 |
| 2015 | $1,146 | $53,190 | $0 | $0 |
| 2014 | $988 | $53,190 | $0 | $0 |
| 2013 | $966 | $0 | $0 | $0 |
| 2012 | -- | $58,070 | $10,120 | $47,950 |
Source: Public Records
Map
Nearby Homes
- 1027 W 13th St
- 1031 W 13th St
- 1023 W 13th St
- 1101 W 13th St
- 1028 W 13th St
- 1030 W 13th St
- 1022 W 13th St
- 1022 W 13th St
- 1107 W 13th St
- 1102 W 13th St
- 1221 N Myrtle St
- 1111 W 13th St
- 1014 W 13th St
- 1228 N Myrtle St
- 1304 Vine St
- 1110 W 13th St
- 1115 W 13th St
- 1319 N Myrtle St
- 1120 W 13th St
- 1312 Vine St