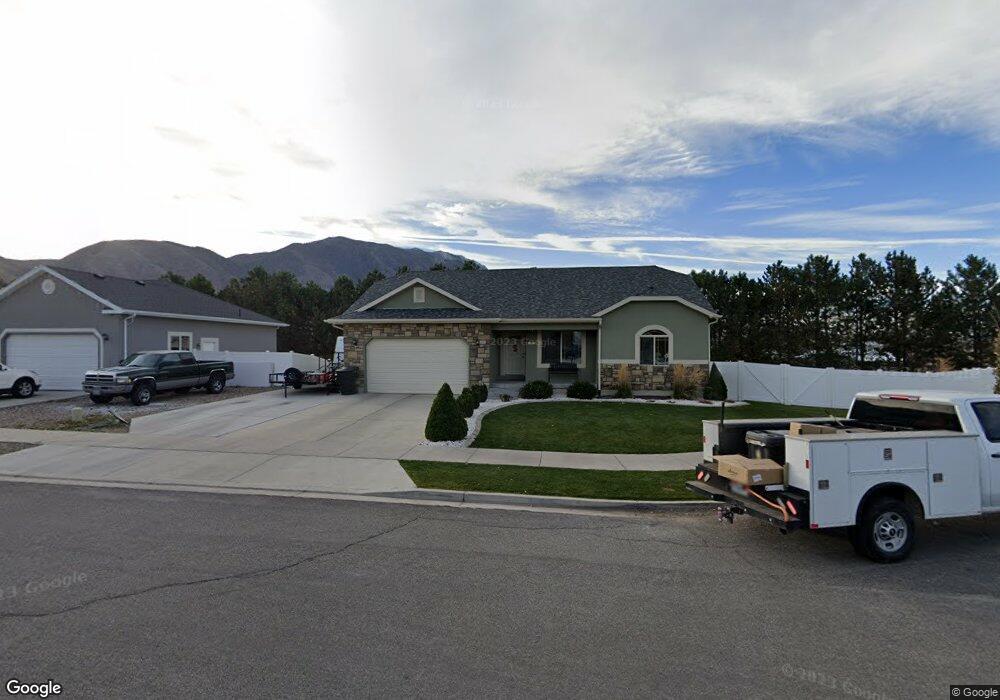
1027 W 1620 S Payson, UT 84651
Estimated Value: $483,000 - $548,913
3
Beds
2
Baths
1,349
Sq Ft
$390/Sq Ft
Est. Value
About This Home
This home is located at 1027 W 1620 S, Payson, UT 84651 and is currently estimated at $525,638, approximately $389 per square foot. 1027 W 1620 S is a home located in Utah County with nearby schools including Spring Lake Elementary, Payson Junior High School, and Payson High School.
Ownership History
Date
Name
Owned For
Owner Type
Purchase Details
Closed on
Jul 30, 2012
Sold by
Rural Housing Development Corp
Bought by
Savage Steven W and Savage Sydney
Current Estimated Value
Home Financials for this Owner
Home Financials are based on the most recent Mortgage that was taken out on this home.
Original Mortgage
$5,000
Outstanding Balance
$3,976
Interest Rate
3.65%
Mortgage Type
Purchase Money Mortgage
Estimated Equity
$521,662
Purchase Details
Closed on
Mar 15, 2012
Sold by
Kriser Development Inc
Bought by
Rural Housing Development Corp
Purchase Details
Closed on
Aug 4, 2008
Sold by
Kriser Homes & Communities Inc
Bought by
Kriser Development Inc
Purchase Details
Closed on
Jun 1, 2007
Sold by
Kriser Developments Inc
Bought by
Kriser Homes & Communities Inc
Home Financials for this Owner
Home Financials are based on the most recent Mortgage that was taken out on this home.
Original Mortgage
$550,000
Interest Rate
6.12%
Mortgage Type
Purchase Money Mortgage
Create a Home Valuation Report for This Property
The Home Valuation Report is an in-depth analysis detailing your home's value as well as a comparison with similar homes in the area
Home Values in the Area
Average Home Value in this Area
Purchase History
| Date | Buyer | Sale Price | Title Company |
|---|---|---|---|
| Savage Steven W | -- | Meridian Title Company | |
| Rural Housing Development Corp | -- | None Available | |
| Kriser Development Inc | -- | Mountain West Title Company | |
| Kriser Homes & Communities Inc | -- | Mountain West Title Company |
Source: Public Records
Mortgage History
| Date | Status | Borrower | Loan Amount |
|---|---|---|---|
| Open | Savage Steven W | $5,000 | |
| Previous Owner | Kriser Homes & Communities Inc | $550,000 |
Source: Public Records
Tax History
| Year | Tax Paid | Tax Assessment Tax Assessment Total Assessment is a certain percentage of the fair market value that is determined by local assessors to be the total taxable value of land and additions on the property. | Land | Improvement |
|---|---|---|---|---|
| 2025 | $2,587 | $283,140 | -- | -- |
| 2024 | $2,587 | $263,230 | $0 | $0 |
| 2023 | $2,623 | $267,685 | $0 | $0 |
| 2022 | $2,721 | $273,075 | $0 | $0 |
| 2021 | $2,054 | $330,700 | $120,200 | $210,500 |
| 2020 | $1,945 | $306,400 | $109,300 | $197,100 |
| 2019 | $1,781 | $287,600 | $90,500 | $197,100 |
| 2018 | $1,610 | $250,600 | $79,200 | $171,400 |
| 2017 | $1,597 | $133,650 | $0 | $0 |
| 2016 | $1,544 | $128,425 | $0 | $0 |
| 2015 | $1,504 | $124,245 | $0 | $0 |
| 2014 | $1,372 | $114,125 | $0 | $0 |
Source: Public Records
Map
Nearby Homes
- 1733 S 1100 W
- 1763 S 1100 W Unit 14
- 1468 S 910 W
- 1631 S Highway 198
- 802 Brookside Ct
- 1338 S 1050 W
- 2003 S 1150 W Unit 1040
- 609 W Saddlebrook Dr
- 613 W Saddlebrook Dr
- 1333 S 1050 W
- 1320 S 950 W
- 1116 W 1290 S
- 1146 W 1260 S
- 1216 S 1150 W Unit 19
- 1835 S 410 W
- 1172 S 880 W
- 1128 W 1150 S Unit 9
- 9022 S 4400 W
- 245 W 1770 S
- 1192 W 1130 St S Unit 202
- 1007 W 1620 S
- 1037 W 1620 S
- 1018 W 1620 S
- 1618 S 1030 W
- 998 W 1620 S
- 979 W 1620 S
- 1612 S 1030 W
- 984 W 1620 S
- 1685 S 1100 W Unit 10
- 1651 S 1100 W
- 1651 S 1100 W Unit 9
- 1717 S 1100 W
- 1003 W 1600 S
- 1606 S 1030 W
- 965 W 1620 S
- 968 W 1620 S
- 1613 S 1100 W Unit 8
- 1613 S 1100 W
- 987 W 1600 S
- 1733 S 1100 W Unit 12
Your Personal Tour Guide
Ask me questions while you tour the home.