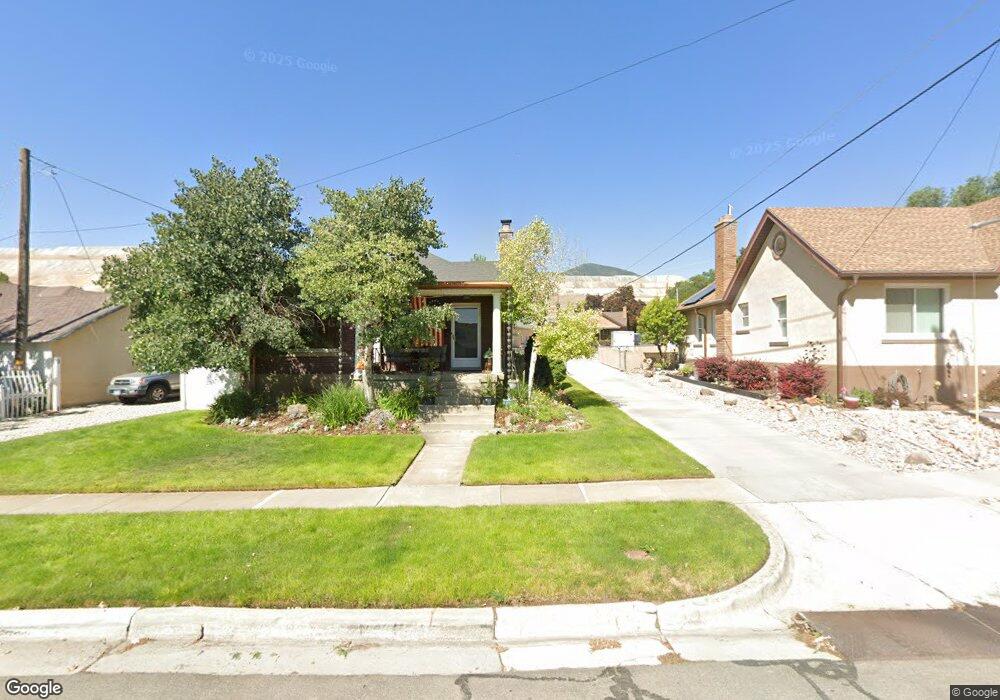
10274 S Freeman Gulch Way Bingham Canyon, UT 84006
Estimated Value: $378,000 - $425,973
3
Beds
1
Bath
980
Sq Ft
$407/Sq Ft
Est. Value
About This Home
This home is located at 10274 S Freeman Gulch Way, Bingham Canyon, UT 84006 and is currently estimated at $398,993, approximately $407 per square foot. 10274 S Freeman Gulch Way is a home located in Salt Lake County with nearby schools including Copper Canyon School, Sunset Ridge Middle School, and Copper Hills High School.
Ownership History
Date
Name
Owned For
Owner Type
Purchase Details
Closed on
Sep 17, 2021
Sold by
Shosted Erick A and Shosted Shelly A
Bought by
Shosted Erick A and Shosted Shelly A
Current Estimated Value
Purchase Details
Closed on
Dec 7, 2001
Sold by
Curtis Gary Carl and Shosted Patricia Ann
Bought by
Shosted Erick A and Shosted Shelly A
Home Financials for this Owner
Home Financials are based on the most recent Mortgage that was taken out on this home.
Original Mortgage
$95,120
Outstanding Balance
$37,444
Interest Rate
6.67%
Mortgage Type
Purchase Money Mortgage
Estimated Equity
$361,549
Purchase Details
Closed on
Sep 29, 1999
Sold by
Davis Kenneth R and Bryant Sidney
Bought by
Washington Darren and Washington Kassie
Home Financials for this Owner
Home Financials are based on the most recent Mortgage that was taken out on this home.
Original Mortgage
$84,320
Interest Rate
9.62%
Mortgage Type
Purchase Money Mortgage
Create a Home Valuation Report for This Property
The Home Valuation Report is an in-depth analysis detailing your home's value as well as a comparison with similar homes in the area
Home Values in the Area
Average Home Value in this Area
Purchase History
| Date | Buyer | Sale Price | Title Company |
|---|---|---|---|
| Shosted Erick A | -- | None Available | |
| Shosted Erick A | -- | Superior Title | |
| Washington Darren | -- | Associated Title |
Source: Public Records
Mortgage History
| Date | Status | Borrower | Loan Amount |
|---|---|---|---|
| Open | Shosted Erick A | $95,120 | |
| Previous Owner | Washington Darren | $84,320 | |
| Closed | Washington Darren | $2,000 |
Source: Public Records
Tax History Compared to Growth
Tax History
| Year | Tax Paid | Tax Assessment Tax Assessment Total Assessment is a certain percentage of the fair market value that is determined by local assessors to be the total taxable value of land and additions on the property. | Land | Improvement |
|---|---|---|---|---|
| 2025 | $2,618 | $398,000 | $102,800 | $295,200 |
| 2024 | $2,618 | $396,600 | $100,800 | $295,800 |
| 2023 | $2,564 | $368,700 | $96,900 | $271,800 |
| 2022 | $2,581 | $374,600 | $95,000 | $279,600 |
| 2021 | $2,200 | $293,100 | $75,000 | $218,100 |
| 2020 | $1,747 | $212,700 | $65,000 | $147,700 |
| 2019 | $1,709 | $206,500 | $65,000 | $141,500 |
| 2018 | $0 | $192,900 | $61,000 | $131,900 |
| 2017 | $1,495 | $180,500 | $61,000 | $119,500 |
| 2016 | $1,520 | $175,000 | $61,000 | $114,000 |
| 2015 | $1,569 | $175,500 | $72,800 | $102,700 |
| 2014 | $1,511 | $165,500 | $69,600 | $95,900 |
Source: Public Records
Map
Nearby Homes
- 8640 W State Hwy
- 1982 W 9325 S Unit 23
- 11174 S Fordman Way
- 7061 S Jordan Pkwy W
- 11178 S Fordman Way
- 11184 S Fordman Way
- 7059 S Jordan Pkwy W Unit 388
- 11188 S Fordman Way
- 11194 S Fordman Way
- 7051 S Jordan Pkwy W Unit 386
- 11204 S Fordman Way
- 11208 S Fordman Way
- 7043 S Jordan Pkwy W
- 7047 W Swansea Dr
- 7046 W Swansea Dr
- 11184 S Easy Bee Rd Unit 265
- 7148 W Lake Ave
- 7086 W Docksider Dr Unit 274
- 11192 S Easy Bee Rd Unit 262
- 11214 S Easy Bee Rd Unit 270
- 10266 S Freeman Gulch Way
- 8752 W Park St
- 8744 W Park St
- 8760 W Park St
- 10271 S Freeman Gulch Way
- 10271 S Freeman Gulch Way
- 103 E Park St
- 8766 W Park St
- 105 E Park St
- 8765 W State Hwy
- 8724 W Park St
- 10265 S Freeman Gulch Way
- 8773 W State Hwy
- 8743 W State Hwy
- 8784 W Park St
- 8716 W Park St
- 8781 W State Hwy
- 10275 S Dryfork Rd
- 10310 S Freeman Gulch Way
- 8735 W State Hwy