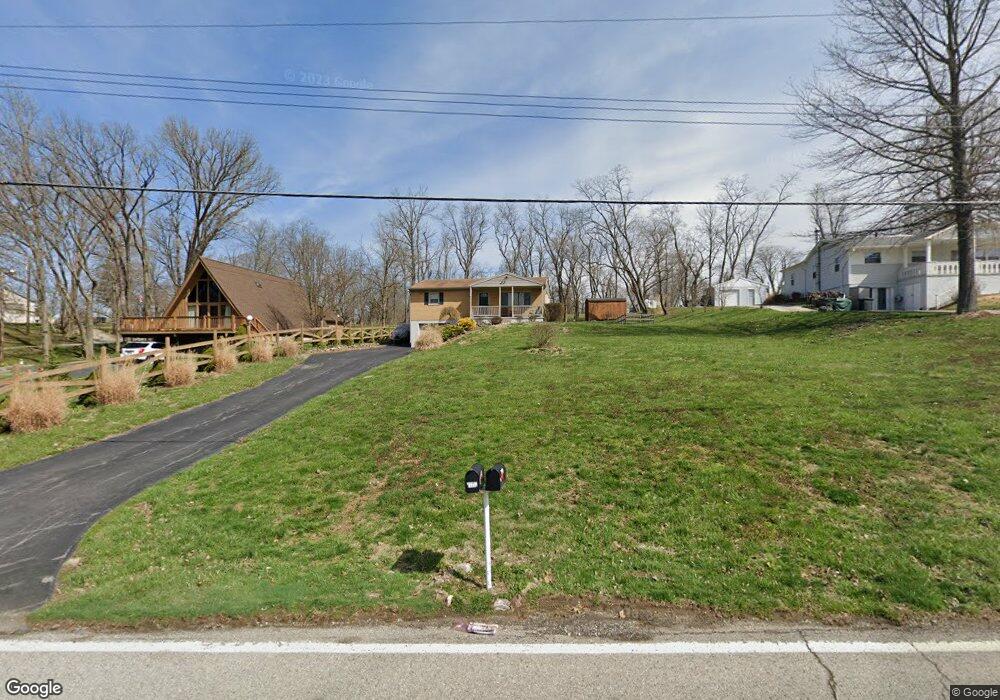
10276 Dugan Gap Rd North Bend, OH 45052
Estimated Value: $184,120 - $251,000
2
Beds
1
Bath
888
Sq Ft
$245/Sq Ft
Est. Value
About This Home
This home is located at 10276 Dugan Gap Rd, North Bend, OH 45052 and is currently estimated at $217,780, approximately $245 per square foot. 10276 Dugan Gap Rd is a home located in Hamilton County with nearby schools including Charles T. Young Elementary School, Taylor Middle School, and Taylor High School.
Ownership History
Date
Name
Owned For
Owner Type
Purchase Details
Closed on
May 19, 2017
Sold by
Ballew Jerad and Ballew Stephanie A
Bought by
Mckenney Matthew
Current Estimated Value
Home Financials for this Owner
Home Financials are based on the most recent Mortgage that was taken out on this home.
Original Mortgage
$120,765
Outstanding Balance
$99,265
Interest Rate
4.03%
Mortgage Type
New Conventional
Estimated Equity
$118,515
Purchase Details
Closed on
Apr 29, 2005
Sold by
Doll Christopher L and Doll Amy M
Bought by
Balley Jerad and Burg Stephanie A
Home Financials for this Owner
Home Financials are based on the most recent Mortgage that was taken out on this home.
Original Mortgage
$109,200
Interest Rate
6.06%
Mortgage Type
Fannie Mae Freddie Mac
Purchase Details
Closed on
Apr 26, 2001
Sold by
Harding Donald W and Harding Albert U
Bought by
Doll Christopher L
Home Financials for this Owner
Home Financials are based on the most recent Mortgage that was taken out on this home.
Original Mortgage
$77,600
Interest Rate
6.95%
Create a Home Valuation Report for This Property
The Home Valuation Report is an in-depth analysis detailing your home's value as well as a comparison with similar homes in the area
Home Values in the Area
Average Home Value in this Area
Purchase History
| Date | Buyer | Sale Price | Title Company |
|---|---|---|---|
| Mckenney Matthew | $124,500 | None Available | |
| Balley Jerad | $115,000 | None Available | |
| Doll Christopher L | $80,000 | -- |
Source: Public Records
Mortgage History
| Date | Status | Borrower | Loan Amount |
|---|---|---|---|
| Open | Mckenney Matthew | $120,765 | |
| Previous Owner | Balley Jerad | $109,200 | |
| Previous Owner | Doll Christopher L | $77,600 |
Source: Public Records
Tax History
| Year | Tax Paid | Tax Assessment Tax Assessment Total Assessment is a certain percentage of the fair market value that is determined by local assessors to be the total taxable value of land and additions on the property. | Land | Improvement |
|---|---|---|---|---|
| 2025 | $2,544 | $48,455 | $13,808 | $34,647 |
| 2023 | $2,263 | $48,455 | $13,808 | $34,647 |
| 2022 | $2,598 | $43,575 | $12,551 | $31,024 |
| 2021 | $2,527 | $43,575 | $12,551 | $31,024 |
| 2020 | $2,553 | $43,575 | $12,551 | $31,024 |
| 2019 | $2,755 | $43,575 | $12,551 | $31,024 |
| 2018 | $2,649 | $43,575 | $12,551 | $31,024 |
| 2017 | $2,484 | $43,575 | $12,551 | $31,024 |
| 2016 | $1,703 | $30,703 | $14,942 | $15,761 |
| 2015 | $1,721 | $30,703 | $14,942 | $15,761 |
| 2014 | $1,739 | $30,703 | $14,942 | $15,761 |
| 2013 | $1,702 | $30,703 | $14,942 | $15,761 |
Source: Public Records
Map
Nearby Homes
- 2545 Cliff Rd
- 9568 Mount Nebo Rd
- 1540 Autumn Ridge Dr
- 1522 Autumn Ridge Dr
- 1759 Barons Cove
- 1226 Breckenridge Ln
- 11225 U S 50
- 1218 Breckenridge Ln
- 7284 W Harrison Ave
- 2313 John James Ct
- 21 Wamsley Ave
- 1662 Bingham Cir
- 1697 Bingham Cir
- 1083 Breckenridge Ln
- 0 Hidden Valley Dr
- TBD Do Not Use
- 101 E State Rd
- 803 N Bend Rd
- 104 W Laird St
- 22 Skidmore St
- 10286 Dugan Gap Rd
- 10268 Dugan Gap Rd
- 10287 Dugan Gap Rd
- 10304 Dugan Gap Rd
- 10260 Dugan Gap Rd
- 10301 Dugan Gap Rd
- 10248 Dugan Gap Rd
- 10289 Dugan Gap Rd
- 10307 Dugan Gap Rd
- 10236 Dugan Gap Rd
- 10315 Dugan Gap Rd
- 10228 Dugan Gap Rd
- 10233 Dugan Gap Rd
- 10220 Dugan Gap Rd
- 10356 Dugan Gap Rd
- 10380 Dugan Gap Rd
- 10212 Dugan Gap Rd
- 10213 Dugan Gap Rd
- 10221 Dugan Gap Rd
- 10347 Dugan Gap Rd
Your Personal Tour Guide
Ask me questions while you tour the home.