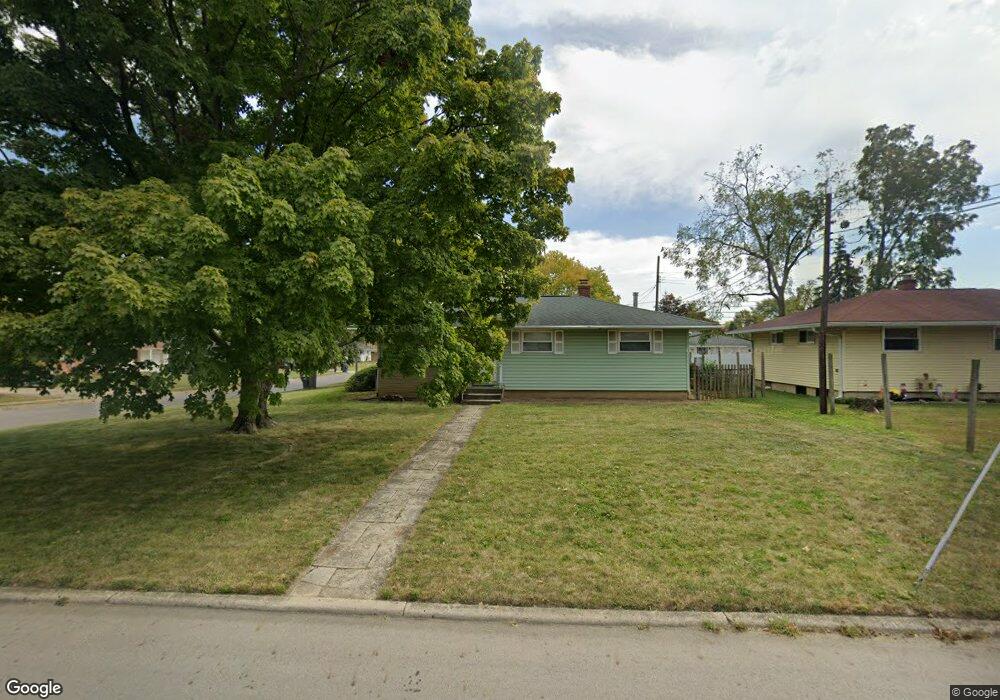
1028 Bellflower Ave Columbus, OH 43204
Brookshire NeighborhoodEstimated Value: $164,000 - $235,000
3
Beds
3
Baths
1,222
Sq Ft
$159/Sq Ft
Est. Value
About This Home
This home is located at 1028 Bellflower Ave, Columbus, OH 43204 and is currently estimated at $194,759, approximately $159 per square foot. 1028 Bellflower Ave is a home located in Franklin County with nearby schools including Lindbergh Elementary School, Hilltonia Middle School, and Briggs High School.
Ownership History
Date
Name
Owned For
Owner Type
Purchase Details
Closed on
Oct 8, 2025
Sold by
Stonebraker Jeffrey A and Stonebraker Crista M
Bought by
Homeplan Llc
Current Estimated Value
Home Financials for this Owner
Home Financials are based on the most recent Mortgage that was taken out on this home.
Original Mortgage
$181,800
Outstanding Balance
$181,800
Interest Rate
6.5%
Mortgage Type
Construction
Estimated Equity
$12,959
Purchase Details
Closed on
Sep 13, 2002
Sold by
Teagardner Roberta J and Teagardner Roberta J
Bought by
Stonebraker Jeffrey A and Stonebraker Crista M
Home Financials for this Owner
Home Financials are based on the most recent Mortgage that was taken out on this home.
Original Mortgage
$104,550
Interest Rate
6.32%
Mortgage Type
VA
Purchase Details
Closed on
Jan 1, 1985
Create a Home Valuation Report for This Property
The Home Valuation Report is an in-depth analysis detailing your home's value as well as a comparison with similar homes in the area
Home Values in the Area
Average Home Value in this Area
Purchase History
| Date | Buyer | Sale Price | Title Company |
|---|---|---|---|
| Homeplan Llc | $161,300 | Valmer Land Title | |
| Stonebraker Jeffrey A | $102,500 | Title First Agency Inc | |
| -- | $46,900 | -- |
Source: Public Records
Mortgage History
| Date | Status | Borrower | Loan Amount |
|---|---|---|---|
| Open | Homeplan Llc | $181,800 | |
| Previous Owner | Stonebraker Jeffrey A | $104,550 |
Source: Public Records
Tax History
| Year | Tax Paid | Tax Assessment Tax Assessment Total Assessment is a certain percentage of the fair market value that is determined by local assessors to be the total taxable value of land and additions on the property. | Land | Improvement |
|---|---|---|---|---|
| 2025 | $2,875 | $64,050 | $14,490 | $49,560 |
| 2024 | $2,875 | $64,050 | $14,490 | $49,560 |
| 2023 | $2,838 | $64,050 | $14,490 | $49,560 |
| 2022 | $2,384 | $45,960 | $8,400 | $37,560 |
| 2021 | $2,388 | $45,960 | $8,400 | $37,560 |
| 2020 | $2,391 | $45,960 | $8,400 | $37,560 |
| 2019 | $2,317 | $38,190 | $7,000 | $31,190 |
| 2018 | $1,983 | $38,190 | $7,000 | $31,190 |
| 2017 | $2,069 | $38,190 | $7,000 | $31,190 |
| 2016 | $1,822 | $27,510 | $5,950 | $21,560 |
| 2015 | $1,654 | $27,510 | $5,950 | $21,560 |
| 2014 | $1,658 | $27,510 | $5,950 | $21,560 |
| 2013 | $985 | $32,375 | $7,000 | $25,375 |
Source: Public Records
Map
Nearby Homes
- 1147 Parma Ave
- 2757 Bernadette Rd
- 2743 Bernadette Rd
- 903 S Harris Ave
- 2692 Regina Ave
- 884 S Hague Ave
- 857 Regina Ct
- 2856 Vanderberg Ave Unit 858
- 839-841 S Ogden Ave
- 2712 Eakin Rd
- 3029 Rosedale Ave
- 988 S Roys Ave
- 814 Chestershire Rd
- 2585 Eakin Rd
- 2870 Chesfield Dr
- 811 Chestershire Rd
- 2856 Chesfield Dr
- 894 Binns Blvd
- 733 S Hague Ave
- 2515 Lindbergh Dr
- 1036 Bellflower Ave
- 1035 Parma Ave
- 1041 Parma Ave
- 1042 Bellflower Ave
- 2802 Rosedale Ave
- 2794 Rosedale Ave
- 2810 Rosedale Ave
- 1025 Bellflower Ave
- 1049 Parma Ave
- 1033 Bellflower Ave
- 2784 Rosedale Ave
- 2818 Rosedale Ave
- 1050 Bellflower Ave
- 1041 Bellflower Ave
- 1057 Parma Ave
- 2776 Rosedale Ave
- 2771 Rosedale Ave
- 1049 Bellflower Ave
- 1058 Bellflower Ave
- 2795 Saint Joseph Ave
Your Personal Tour Guide
Ask me questions while you tour the home.