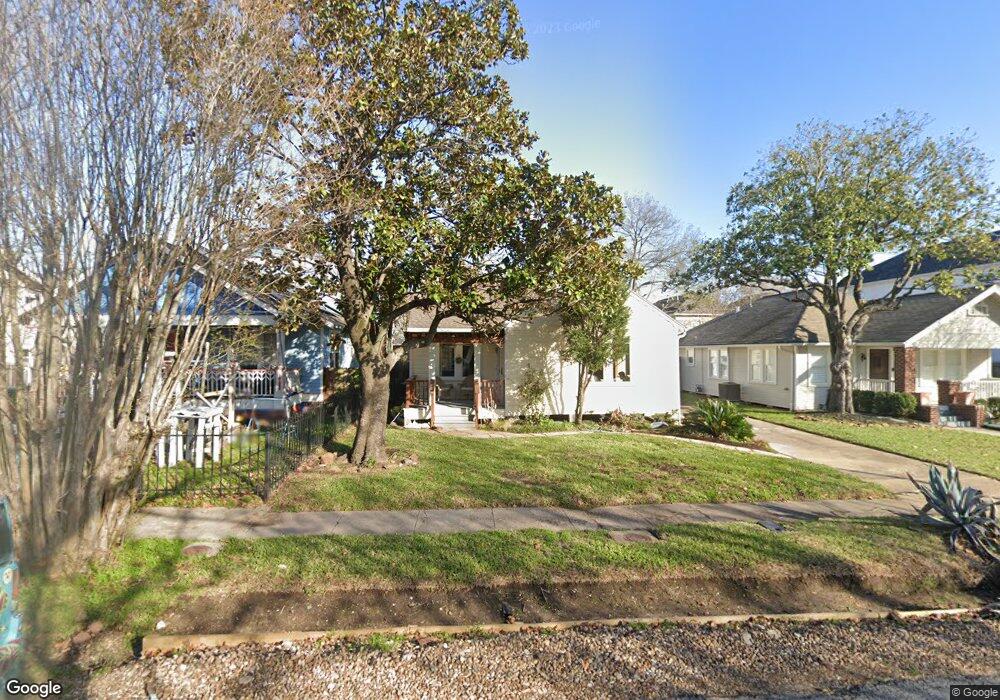
1028 Lawrence St Unit 1 Houston, TX 77008
Greater Heights NeighborhoodEstimated Value: $671,000 - $692,000
2
Beds
3
Baths
1,409
Sq Ft
$485/Sq Ft
Est. Value
About This Home
This home is located at 1028 Lawrence St Unit 1, Houston, TX 77008 and is currently estimated at $683,924, approximately $485 per square foot. 1028 Lawrence St Unit 1 is a home located in Harris County with nearby schools including Love Elementary School, Hogg Middle, and Heights High School.
Ownership History
Date
Name
Owned For
Owner Type
Purchase Details
Closed on
Apr 19, 2019
Sold by
Jennings Rixford Owen
Bought by
Phillips Jennings Suzanne
Current Estimated Value
Purchase Details
Closed on
Jul 25, 2001
Sold by
Hill Richard
Bought by
Jennings Rixford
Home Financials for this Owner
Home Financials are based on the most recent Mortgage that was taken out on this home.
Original Mortgage
$116,000
Outstanding Balance
$44,476
Interest Rate
7.07%
Estimated Equity
$639,448
Purchase Details
Closed on
Aug 5, 1998
Sold by
Heights Heritage Homes Inc
Bought by
Hill Richard
Purchase Details
Closed on
Jun 7, 1996
Sold by
Keystone Development Corp
Bought by
Echometer Sonolog Inc
Home Financials for this Owner
Home Financials are based on the most recent Mortgage that was taken out on this home.
Original Mortgage
$600,000
Interest Rate
8.02%
Mortgage Type
Purchase Money Mortgage
Create a Home Valuation Report for This Property
The Home Valuation Report is an in-depth analysis detailing your home's value as well as a comparison with similar homes in the area
Home Values in the Area
Average Home Value in this Area
Purchase History
| Date | Buyer | Sale Price | Title Company |
|---|---|---|---|
| Phillips Jennings Suzanne | -- | None Available | |
| Phillips Jennings Rixford Owen | -- | None Available | |
| Jennings Rixford | -- | -- | |
| Hill Richard | -- | Chicago Title | |
| Echometer Sonolog Inc | -- | Stewart Title |
Source: Public Records
Mortgage History
| Date | Status | Borrower | Loan Amount |
|---|---|---|---|
| Open | Jennings Rixford | $116,000 | |
| Previous Owner | Echometer Sonolog Inc | $600,000 |
Source: Public Records
Tax History Compared to Growth
Tax History
| Year | Tax Paid | Tax Assessment Tax Assessment Total Assessment is a certain percentage of the fair market value that is determined by local assessors to be the total taxable value of land and additions on the property. | Land | Improvement |
|---|---|---|---|---|
| 2025 | $2,959 | $601,717 | $525,000 | $76,717 |
| 2024 | $2,959 | $496,286 | $420,000 | $76,286 |
| 2023 | $2,959 | $483,854 | $420,000 | $63,854 |
| 2022 | $9,170 | $416,448 | $367,500 | $48,948 |
| 2021 | $9,457 | $405,767 | $341,250 | $64,517 |
| 2020 | $9,037 | $373,172 | $315,000 | $58,172 |
| 2019 | $8,761 | $346,207 | $288,750 | $57,457 |
| 2018 | $3,303 | $327,435 | $262,500 | $64,935 |
| 2017 | $8,279 | $327,435 | $262,500 | $64,935 |
| 2016 | $7,674 | $345,544 | $294,000 | $51,544 |
| 2015 | $2,545 | $345,544 | $294,000 | $51,544 |
| 2014 | $2,545 | $261,600 | $210,000 | $51,600 |
Source: Public Records
Map
Nearby Homes
- 1033 Herkimer St
- 1016 Alexander St
- 1001 Lawrence St
- 925 Herkimer St
- 1022 Dorothy St
- 1035 Waverly St Unit B
- 945 Waverly St
- 1024 Waverly St
- 1031 Ashland St
- 1116 Waverly St
- 601 W 10th St
- 1104 W 9th St
- 1034 Ashland St Unit A
- 829 Alexander St
- 1124 Ashland St
- 1227 Nicholson St
- 1223 Waverly St
- 816 Dorothy St Unit B
- 811 Herkimer St
- 1106 Tulane St
- 1030 Lawrence St
- 1018 Lawrence St
- 1016 Lawrence St
- 1016 Lawrence St Unit A
- 1016 Lawrence St Unit B
- 1034 Lawrence St
- 1021 Herkimer St
- 1023 Herkimer St
- 1017 Herkimer St Unit B
- 1017 Herkimer St Unit A
- 1017 Herkimer St
- 1025 Herkimer St
- 1014 Lawrence St
- 1027 Herkimer St
- 1015 Herkimer St
- 1012 Lawrence St
- 1029A Herkimer St
- 1025 Lawrence St
- 1031 Lawrence St
- 1031 Lawrence St Unit B