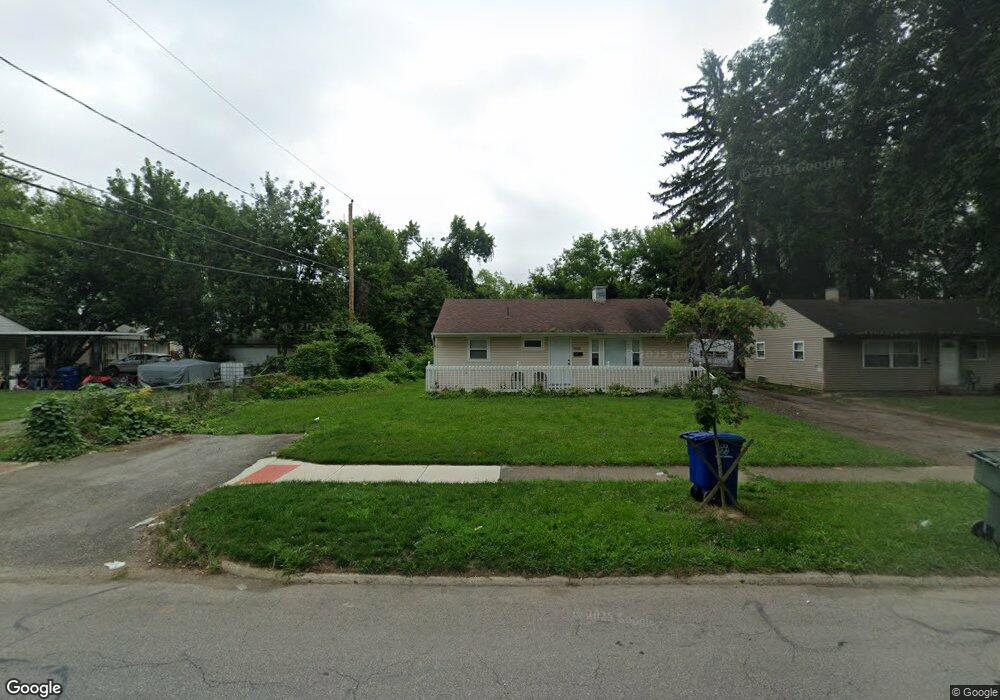
1028 S Hampton Rd Columbus, OH 43227
Eastmoor NeighborhoodEstimated Value: $165,000 - $197,000
3
Beds
1
Bath
1,200
Sq Ft
$152/Sq Ft
Est. Value
About This Home
This home is located at 1028 S Hampton Rd, Columbus, OH 43227 and is currently estimated at $182,039, approximately $151 per square foot. 1028 S Hampton Rd is a home located in Franklin County with nearby schools including Scottwood Elementary School, Johnson Park Middle School, and Walnut Ridge High School.
Ownership History
Date
Name
Owned For
Owner Type
Purchase Details
Closed on
Jun 23, 2022
Sold by
C Holdings Llc
Bought by
R5 Llc
Current Estimated Value
Purchase Details
Closed on
Sep 18, 2020
Sold by
Verdone Robert A and Verdone Marcia F
Bought by
C Holdings Llc
Home Financials for this Owner
Home Financials are based on the most recent Mortgage that was taken out on this home.
Original Mortgage
$92,500
Interest Rate
2.9%
Mortgage Type
Future Advance Clause Open End Mortgage
Purchase Details
Closed on
Sep 8, 2020
Sold by
Verdone Robert A and Verdone Marcia F
Bought by
C Holdings Llc
Home Financials for this Owner
Home Financials are based on the most recent Mortgage that was taken out on this home.
Original Mortgage
$92,500
Interest Rate
2.9%
Mortgage Type
Future Advance Clause Open End Mortgage
Purchase Details
Closed on
Dec 14, 2000
Sold by
Willis Roger W and Willis Peggy M
Bought by
Verdone Robert A and Verdone Marcia F
Home Financials for this Owner
Home Financials are based on the most recent Mortgage that was taken out on this home.
Original Mortgage
$52,000
Interest Rate
7.83%
Purchase Details
Closed on
Nov 20, 1989
Bought by
Willis Roger W and Willis Peggy M
Create a Home Valuation Report for This Property
The Home Valuation Report is an in-depth analysis detailing your home's value as well as a comparison with similar homes in the area
Home Values in the Area
Average Home Value in this Area
Purchase History
| Date | Buyer | Sale Price | Title Company |
|---|---|---|---|
| R5 Llc | -- | Axxis Title | |
| C Holdings Llc | $67,000 | Axxis Title Agency Ltd | |
| C Holdings Llc | $67,000 | Axxis Title | |
| Verdone Robert A | $65,000 | Connor Title Co | |
| Willis Roger W | $41,900 | -- |
Source: Public Records
Mortgage History
| Date | Status | Borrower | Loan Amount |
|---|---|---|---|
| Previous Owner | C Holdings Llc | $92,500 | |
| Previous Owner | C Holdings Llc | $92,500 | |
| Previous Owner | Verdone Robert A | $52,000 |
Source: Public Records
Tax History Compared to Growth
Tax History
| Year | Tax Paid | Tax Assessment Tax Assessment Total Assessment is a certain percentage of the fair market value that is determined by local assessors to be the total taxable value of land and additions on the property. | Land | Improvement |
|---|---|---|---|---|
| 2024 | $2,490 | $54,330 | $13,200 | $41,130 |
| 2023 | $2,459 | $54,320 | $13,195 | $41,125 |
| 2022 | $1,856 | $34,930 | $6,440 | $28,490 |
| 2021 | $2,010 | $34,930 | $6,440 | $28,490 |
| 2020 | $1,193 | $22,370 | $6,440 | $15,930 |
| 2019 | $1,204 | $18,030 | $5,360 | $12,670 |
| 2018 | $560 | $18,030 | $5,360 | $12,670 |
| 2017 | $1,117 | $18,030 | $5,360 | $12,670 |
| 2016 | $1,113 | $16,380 | $4,270 | $12,110 |
| 2015 | $507 | $16,380 | $4,270 | $12,110 |
| 2014 | $1,016 | $16,380 | $4,270 | $12,110 |
| 2013 | $557 | $18,200 | $4,760 | $13,440 |
Source: Public Records
Map
Nearby Homes
- 1054 S Hampton Rd
- 3325 Towers Ct S
- 3339 Towers Ct N
- 1048 S James Rd
- 891 S Weyant Ave Unit 893
- 1077-1079 S James Rd
- 864 S Waverly St
- 842 S Hampton Rd
- 804 S Ashburton Rd
- 1271 S Weyant Ave
- 3012 Hampshire Rd
- 836 S Weyant Ave
- 2963 Brownlee Ave
- 892 Ruby Ave
- 711 S Waverly St
- 2856 Eastminster Rd
- 708 S Waverly St
- 3563 Astor Ave
- 733 S Napoleon Ave
- 3598 Astor Ave
- 1034 S Hampton Rd
- 1042 S Hampton Rd
- 3215 Astor Ave
- 3209 Astor Ave
- 3219 Astor Ave
- 1035 S Waverly St
- 1041 S Waverly St
- 1048 S Hampton Rd
- 3227 Astor Ave
- 1047 S Waverly St
- 3189 Astor Ave
- 3233 Astor Ave
- 1025 S Hampton Rd
- 1031 S Hampton Rd
- 1053 S Waverly St
- 1039 S Hampton Rd
- 3183 Astor Ave
- 1061 S Waverly St
- 1045 S Hampton Rd
- 1062 S Hampton Rd