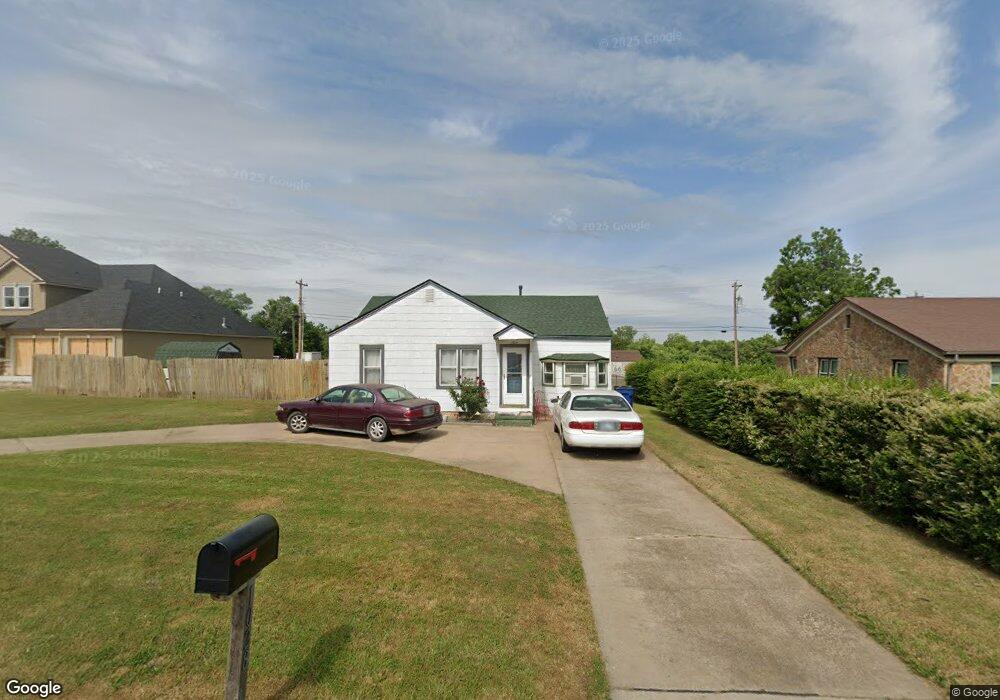
1028 S Reno Ave El Reno, OK 73036
Estimated Value: $99,000 - $152,629
3
Beds
2
Baths
1,118
Sq Ft
$108/Sq Ft
Est. Value
About This Home
This home is located at 1028 S Reno Ave, El Reno, OK 73036 and is currently estimated at $120,907, approximately $108 per square foot. 1028 S Reno Ave is a home located in Canadian County with nearby schools including Hillcrest Elementary School, Rose Witcher Elementary School, and Lincoln Learning Center.
Ownership History
Date
Name
Owned For
Owner Type
Purchase Details
Closed on
Aug 29, 2013
Sold by
Lee James Michael
Bought by
Kelley Randy L and Kelley Amber
Current Estimated Value
Home Financials for this Owner
Home Financials are based on the most recent Mortgage that was taken out on this home.
Original Mortgage
$44,000
Outstanding Balance
$32,860
Interest Rate
4.42%
Mortgage Type
New Conventional
Estimated Equity
$88,047
Purchase Details
Closed on
Aug 20, 2013
Sold by
Berntsen George F
Bought by
Lee James Michael
Home Financials for this Owner
Home Financials are based on the most recent Mortgage that was taken out on this home.
Original Mortgage
$44,000
Outstanding Balance
$32,860
Interest Rate
4.42%
Mortgage Type
New Conventional
Estimated Equity
$88,047
Purchase Details
Closed on
Mar 13, 1998
Sold by
Lee James Michael
Purchase Details
Closed on
Mar 5, 1998
Sold by
Barnhart John and Barnhart Susan
Purchase Details
Closed on
Dec 28, 1989
Create a Home Valuation Report for This Property
The Home Valuation Report is an in-depth analysis detailing your home's value as well as a comparison with similar homes in the area
Home Values in the Area
Average Home Value in this Area
Purchase History
| Date | Buyer | Sale Price | Title Company |
|---|---|---|---|
| Kelley Randy L | $55,000 | Fatco | |
| Lee James Michael | -- | Fatco | |
| -- | -- | -- | |
| -- | $36,000 | -- | |
| -- | $17,500 | -- |
Source: Public Records
Mortgage History
| Date | Status | Borrower | Loan Amount |
|---|---|---|---|
| Open | Kelley Randy L | $44,000 |
Source: Public Records
Tax History Compared to Growth
Tax History
| Year | Tax Paid | Tax Assessment Tax Assessment Total Assessment is a certain percentage of the fair market value that is determined by local assessors to be the total taxable value of land and additions on the property. | Land | Improvement |
|---|---|---|---|---|
| 2024 | $721 | $7,966 | $1,500 | $6,466 |
| 2023 | $721 | $7,733 | $1,500 | $6,233 |
| 2022 | $700 | $7,508 | $1,500 | $6,008 |
| 2021 | $694 | $7,295 | $1,500 | $5,795 |
| 2020 | $697 | $7,402 | $1,500 | $5,902 |
| 2019 | $711 | $7,256 | $1,500 | $5,756 |
| 2018 | $680 | $7,044 | $1,500 | $5,544 |
| 2017 | $705 | $7,143 | $1,500 | $5,643 |
| 2016 | $694 | $7,010 | $1,500 | $5,510 |
| 2015 | $670 | $6,805 | $1,500 | $5,305 |
| 2014 | $670 | $6,891 | $1,500 | $5,391 |
Source: Public Records
Map
Nearby Homes
- 1127 S Reno Ave
- 1012 S Ellison Ave
- 1260 Penny Ln
- 602 W Elm St
- 1220 Strawberry Fields
- 601 Thompson Dr
- 709 S Hadden Ave
- 1705 S Dille Ave
- 1309 Fairfax Ln
- 605 Thompson Dr
- 1515 Strawberry Fields
- 503 W Owens St
- 1517 Strawberry
- 717 S Miles Ave
- 1519 Strawberry Fields
- 623 S Ellison Ave
- 1523 Strawberry Fields
- 800 Fairfax Ln
- 1502 S Reno Ave
- 520 S Hadden Ave
- 1020 S Reno Ave
- 1040 S Reno Ave
- 1029 S Reno Ave
- 1033 S Reno Ave
- 1037 S Reno Ave
- 1021 S Reno Ave
- 1016 S Reno Ave
- 1046 S Reno Ave
- 1019 S Reno Ave
- 1041 S Reno Ave
- 1050 S Reno Ave
- 1045 S Reno Ave
- 1015 S Reno Ave
- 1049 S Reno Ave
- 1052 S Reno Ave
- 1002 S Reno Ave
- 1032 S Hadden Ave
- 1024 S Hadden Ave
- 1005 S Reno Ave
- 1011 W Elm St