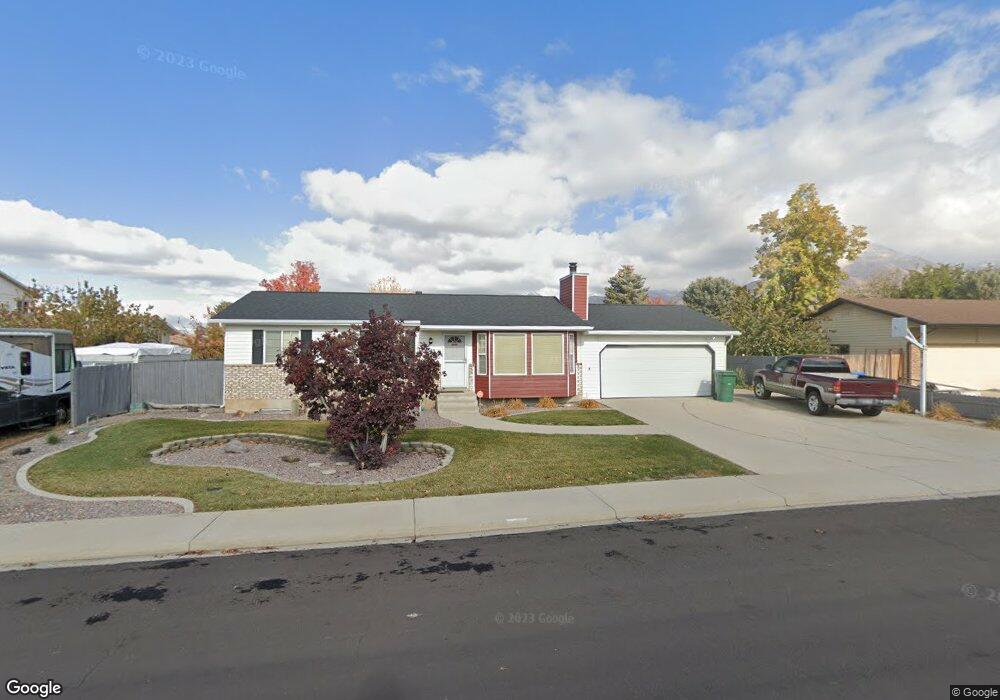
1028 W 1100 N Orem, UT 84057
Bonneville NeighborhoodEstimated Value: $512,000 - $566,000
5
Beds
2
Baths
2,292
Sq Ft
$234/Sq Ft
Est. Value
About This Home
This home is located at 1028 W 1100 N, Orem, UT 84057 and is currently estimated at $535,359, approximately $233 per square foot. 1028 W 1100 N is a home located in Utah County with nearby schools including Bonneville Elementary School, Orem Junior High School, and Timpanogos High School.
Ownership History
Date
Name
Owned For
Owner Type
Purchase Details
Closed on
May 15, 2014
Sold by
Billings Heber and Billings Ashley
Bought by
Glover Scott K
Current Estimated Value
Home Financials for this Owner
Home Financials are based on the most recent Mortgage that was taken out on this home.
Original Mortgage
$125,000
Outstanding Balance
$95,442
Interest Rate
4.38%
Mortgage Type
New Conventional
Estimated Equity
$439,917
Purchase Details
Closed on
Aug 5, 2005
Sold by
Olsen Jack Chris and Olsen Jodie
Bought by
Billings Heber and Billings Ashley
Purchase Details
Closed on
Dec 31, 1998
Sold by
Olsen Jack Chris and Olsen Jodie B
Bought by
Olsen Jack C and Olsen Jodie
Home Financials for this Owner
Home Financials are based on the most recent Mortgage that was taken out on this home.
Original Mortgage
$90,000
Interest Rate
6.73%
Create a Home Valuation Report for This Property
The Home Valuation Report is an in-depth analysis detailing your home's value as well as a comparison with similar homes in the area
Home Values in the Area
Average Home Value in this Area
Purchase History
| Date | Buyer | Sale Price | Title Company |
|---|---|---|---|
| Glover Scott K | -- | Bonneville Superior Title Co | |
| Billings Heber | -- | Signature Title Insurance | |
| Olsen Jack C | -- | Backman Stewart Title |
Source: Public Records
Mortgage History
| Date | Status | Borrower | Loan Amount |
|---|---|---|---|
| Open | Glover Scott K | $125,000 | |
| Previous Owner | Olsen Jack C | $90,000 |
Source: Public Records
Tax History Compared to Growth
Tax History
| Year | Tax Paid | Tax Assessment Tax Assessment Total Assessment is a certain percentage of the fair market value that is determined by local assessors to be the total taxable value of land and additions on the property. | Land | Improvement |
|---|---|---|---|---|
| 2025 | $114 | $259,160 | $194,400 | $276,800 |
| 2024 | $114 | $237,105 | $0 | $0 |
| 2023 | $287 | $237,160 | $0 | $0 |
| 2022 | $287 | $233,530 | $0 | $0 |
| 2021 | $1,708 | $329,400 | $151,800 | $177,600 |
| 2020 | $359 | $295,500 | $121,400 | $174,100 |
| 2019 | $1,398 | $275,500 | $121,400 | $154,100 |
| 2018 | $37 | $257,600 | $111,000 | $146,600 |
| 2017 | $1,309 | $132,055 | $0 | $0 |
| 2016 | $284 | $122,815 | $0 | $0 |
| 2015 | $38 | $108,900 | $0 | $0 |
| 2014 | $757 | $105,215 | $0 | $0 |
Source: Public Records
Map
Nearby Homes
- 999 W 1100 N
- 983 W 1055 N Unit 816
- 1030 N 995 W Unit 915
- 1015 N 995 W
- 1026 N 1090 W Unit 404
- 982 W 960 N Unit 109
- 1081 W 993 N Unit 101
- 1081 W 993 N Unit 202
- 875 W 1130 N
- 930 N 980 W
- 1140 W 950 N Unit D304
- 933 N 900 W
- 947 N 830 W
- 1335 N 1230 W
- 1175 W 1420 N
- 1426 N 1300 W Unit 63
- 738 N 835 W
- 697 W 1400 N
- 1279 W 1480 N
- 1554 N 1150 W