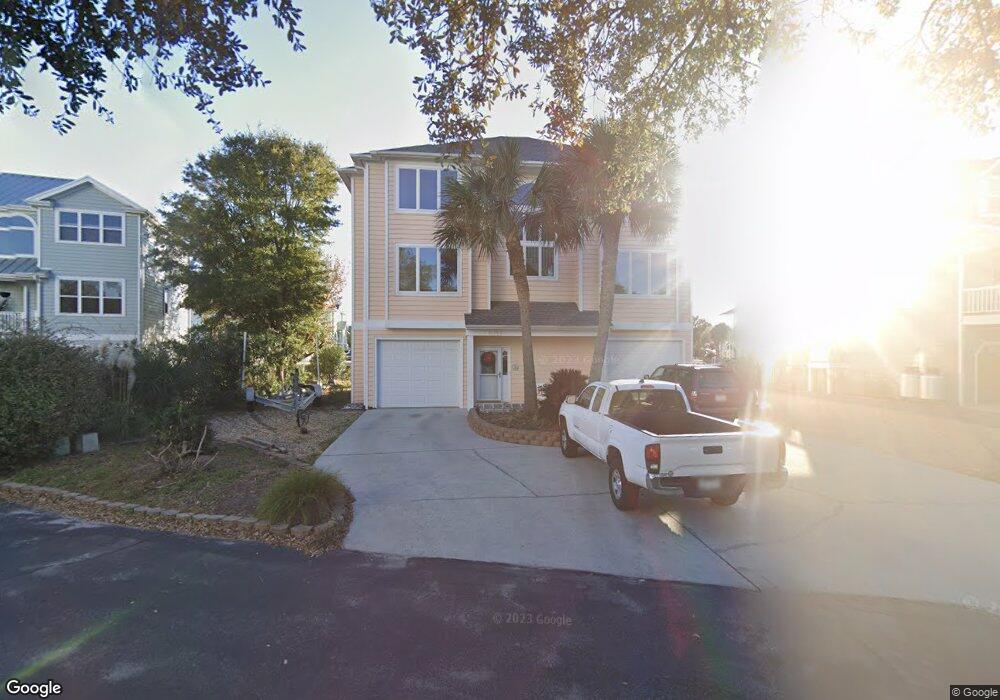
1028 Waterview Ct Carolina Beach, NC 28428
Estimated Value: $1,204,268 - $1,806,000
4
Beds
4
Baths
2,817
Sq Ft
$538/Sq Ft
Est. Value
About This Home
This home is located at 1028 Waterview Ct, Carolina Beach, NC 28428 and is currently estimated at $1,516,817, approximately $538 per square foot. 1028 Waterview Ct is a home located in New Hanover County with nearby schools including Carolina Beach Elementary School, Charles P. Murray Middle School, and Eugene Ashley High School.
Ownership History
Date
Name
Owned For
Owner Type
Purchase Details
Closed on
Aug 16, 2019
Sold by
Software Dynamics Inc
Bought by
Rsp Properties Llc
Current Estimated Value
Home Financials for this Owner
Home Financials are based on the most recent Mortgage that was taken out on this home.
Original Mortgage
$150,000
Outstanding Balance
$65,422
Interest Rate
3.7%
Mortgage Type
Purchase Money Mortgage
Estimated Equity
$1,451,395
Purchase Details
Closed on
Oct 19, 1999
Sold by
Penn Robert L Jr Susan L
Bought by
Penn Family Living Trust
Purchase Details
Closed on
Sep 29, 1999
Sold by
Hester Grady D Peggy Baddour
Bought by
Penn Robert Jr Susan L
Purchase Details
Closed on
May 19, 1995
Sold by
Landsouth Partners
Bought by
Penn Robert L Jr Susan L
Purchase Details
Closed on
Feb 16, 1994
Sold by
Sowamco Viii Ltd
Bought by
Landsouth Partners
Purchase Details
Closed on
Jun 1, 1986
Sold by
South Coast Dev Inc
Bought by
First Federal Of So Car
Create a Home Valuation Report for This Property
The Home Valuation Report is an in-depth analysis detailing your home's value as well as a comparison with similar homes in the area
Home Values in the Area
Average Home Value in this Area
Purchase History
| Date | Buyer | Sale Price | Title Company |
|---|---|---|---|
| Rsp Properties Llc | $200,000 | None Available | |
| Penn Family Living Trust | -- | -- | |
| Penn Robert Jr Susan L | -- | -- | |
| Penn Robert L Jr Susan L | $60,000 | -- | |
| Landsouth Partners | $350,000 | -- | |
| Sowamco Viii Ltd | $350,000 | -- | |
| First Federal Of So Car | $892,000 | -- |
Source: Public Records
Mortgage History
| Date | Status | Borrower | Loan Amount |
|---|---|---|---|
| Open | Rsp Properties Llc | $150,000 |
Source: Public Records
Tax History Compared to Growth
Tax History
| Year | Tax Paid | Tax Assessment Tax Assessment Total Assessment is a certain percentage of the fair market value that is determined by local assessors to be the total taxable value of land and additions on the property. | Land | Improvement |
|---|---|---|---|---|
| 2025 | $5,327 | $1,467,100 | $502,300 | $964,800 |
| 2024 | $5,327 | $777,700 | $295,700 | $482,000 |
| 2023 | $5,327 | $777,700 | $295,700 | $482,000 |
| 2022 | $5,211 | $777,700 | $295,700 | $482,000 |
| 2021 | $5,366 | $777,700 | $295,700 | $482,000 |
| 2020 | $6,173 | $771,600 | $303,800 | $467,800 |
| 2019 | $6,173 | $771,600 | $303,800 | $467,800 |
| 2018 | $6,018 | $771,600 | $303,800 | $467,800 |
| 2017 | $6,134 | $771,600 | $303,800 | $467,800 |
| 2016 | $6,228 | $725,900 | $328,100 | $397,800 |
| 2015 | $5,873 | $725,900 | $328,100 | $397,800 |
| 2014 | $5,727 | $725,900 | $328,100 | $397,800 |
Source: Public Records
Map
Nearby Homes
- 109 Lighthouse Dr
- 1080 Saint Joseph St Unit 9E
- 1080 Saint Joseph St Unit 3b
- 1080 Saint Joseph St Unit P1
- 1080 Saint Joseph St Unit 4C
- 1001 Waterview Place
- 1030 Waterview Ct
- 140 Lighthouse Dr
- 102 Hooks
- 114 Hooks
- 1200 Saint Joseph St Unit 56
- 1200 Saint Joseph St Unit 26
- 1200 Saint Joseph St Unit 66
- 117 Hooks
- 710 Canal Dr
- 901 Canal Dr
- 715 Carolina Beach Ave N
- 619 Carolina Beach Ave N Unit 2
- 602 Canal Dr
- 712 Saint Joseph St Unit 103
- 1026 Waterview Ct
- 1034 Waterview Ct
- 1036 Waterview Ct
- 1007 Waterview Place
- 1009 Waterview Place
- 1020 Saint Joseph St
- 1080 St Joseph St Unit 7a
- 1080 St Joseph St Unit 1e
- 1080 St Joseph St Unit 2e
- 1080 St Joseph St Unit 7d
- 1080 St Joseph St Unit 1a
- 1080 St Joseph St Unit 3d
- 1080 St Joseph St Unit 10C
- 1080 Saint Joseph St Unit 4B
- 1080 Saint Joseph St Unit 4F
- 1080 Saint Joseph St Unit 6E
- 1080 Saint Joseph St Unit 7B
- 1080 Saint Joseph St Unit 5F
- 1080 Saint Joseph St Unit 6b
- 1080 Saint Joseph St