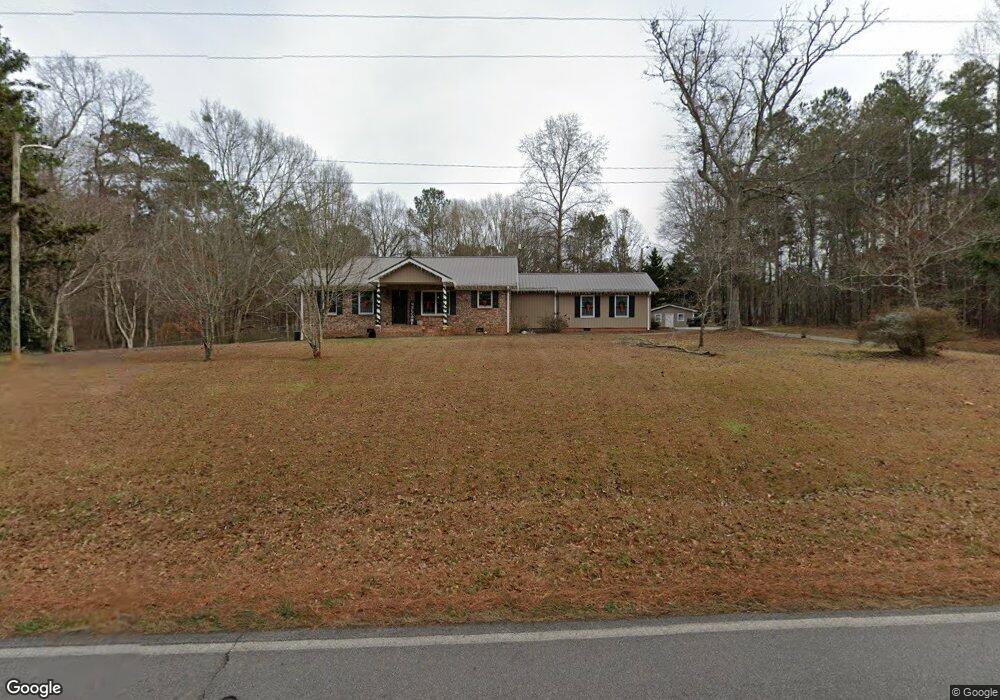
1028 Whooping Creek Church Rd Carrollton, GA 30116
Estimated Value: $209,000 - $301,000
3
Beds
2
Baths
1,573
Sq Ft
$160/Sq Ft
Est. Value
About This Home
This home is located at 1028 Whooping Creek Church Rd, Carrollton, GA 30116 and is currently estimated at $251,288, approximately $159 per square foot. 1028 Whooping Creek Church Rd is a home located in Carroll County with nearby schools including Whitesburg Elementary School, Central Middle School, and Central High School.
Ownership History
Date
Name
Owned For
Owner Type
Purchase Details
Closed on
Jun 22, 2020
Sold by
Leverett David B
Bought by
Justice Brittany Elizabeth
Current Estimated Value
Home Financials for this Owner
Home Financials are based on the most recent Mortgage that was taken out on this home.
Original Mortgage
$160,200
Outstanding Balance
$142,005
Interest Rate
3.2%
Mortgage Type
New Conventional
Estimated Equity
$109,283
Purchase Details
Closed on
Oct 5, 2009
Sold by
Jiles Janet G
Bought by
Leverett David B
Purchase Details
Closed on
Jun 15, 2000
Sold by
York Travis M
Bought by
York Blanche D
Purchase Details
Closed on
Jul 2, 1982
Sold by
York Travis M
Bought by
York Travis M and York Blanche D
Purchase Details
Closed on
Dec 22, 1972
Sold by
Phillips Pearl E
Bought by
York Travis M
Create a Home Valuation Report for This Property
The Home Valuation Report is an in-depth analysis detailing your home's value as well as a comparison with similar homes in the area
Home Values in the Area
Average Home Value in this Area
Purchase History
| Date | Buyer | Sale Price | Title Company |
|---|---|---|---|
| Justice Brittany Elizabeth | $178,000 | -- | |
| Leverett David B | $52,000 | -- | |
| York Blanche D | -- | -- | |
| York Travis M | -- | -- | |
| York Travis M | $16,500 | -- |
Source: Public Records
Mortgage History
| Date | Status | Borrower | Loan Amount |
|---|---|---|---|
| Open | Justice Brittany Elizabeth | $160,200 |
Source: Public Records
Tax History Compared to Growth
Tax History
| Year | Tax Paid | Tax Assessment Tax Assessment Total Assessment is a certain percentage of the fair market value that is determined by local assessors to be the total taxable value of land and additions on the property. | Land | Improvement |
|---|---|---|---|---|
| 2024 | $1,279 | $56,543 | $7,490 | $49,053 |
| 2023 | $1,279 | $50,629 | $5,992 | $44,637 |
| 2022 | $1,002 | $39,961 | $3,995 | $35,966 |
| 2021 | $878 | $34,266 | $3,196 | $31,070 |
| 2020 | $776 | $30,248 | $2,905 | $27,343 |
| 2019 | $733 | $28,331 | $2,905 | $25,426 |
| 2018 | $682 | $25,983 | $2,715 | $23,268 |
| 2017 | $684 | $25,983 | $2,715 | $23,268 |
| 2016 | $685 | $25,983 | $2,715 | $23,268 |
| 2015 | $779 | $27,842 | $3,177 | $24,666 |
| 2014 | $782 | $27,843 | $3,177 | $24,666 |
Source: Public Records
Map
Nearby Homes
- 1233 Whooping Creek Rd
- 1001 Whooping Creek Rd
- 1430 Whooping Creek Church Rd
- 1450 Whooping Creek Church Rd
- 1502 Whooping Creek Church Rd
- 1512 Whooping Creek Church Rd
- 184 Whooping Creek Church Rd
- 113 Red Oak Ln
- 103 Red Oak Ln
- 197 Westbrook Rd
- 143 Oak Leaf Dr Unit 163
- 143 Oak Leaf Dr
- 587 Whooping Creek Rd
- 605 Whooping Creek Rd
- 1915 Whooping Creek Church Rd
- 1031 Whooping Creek Church Rd
- 1001 Whooping Creek Church Rd
- 50 Merrell Rd
- 1012 Whooping Creek Church Rd
- 000 Merrell Rd
- 0 Merrell Rd Unit 4126126
- 0 Merrell Rd Unit 4158627
- 0 Merrell Rd Unit 3278208
- 0 Merrell Rd Unit 8109060
- 0 Merrell Rd Unit 8620952
- 1053 Whooping Creek Church Rd
- 1053 Whooping Creek Church Rd
- 1053 Whooping Creek Church Rd
- 1053 Whooping Creek Church Rd
- 81 Merrell Rd
- 1099 Whooping Creek Church Rd
- 934 Whooping Creek Church Rd
- 1098 Whooping Creek Church Rd
- 1112 Whooping Creek Church Rd
- 1105 Whooping Creek Church Rd