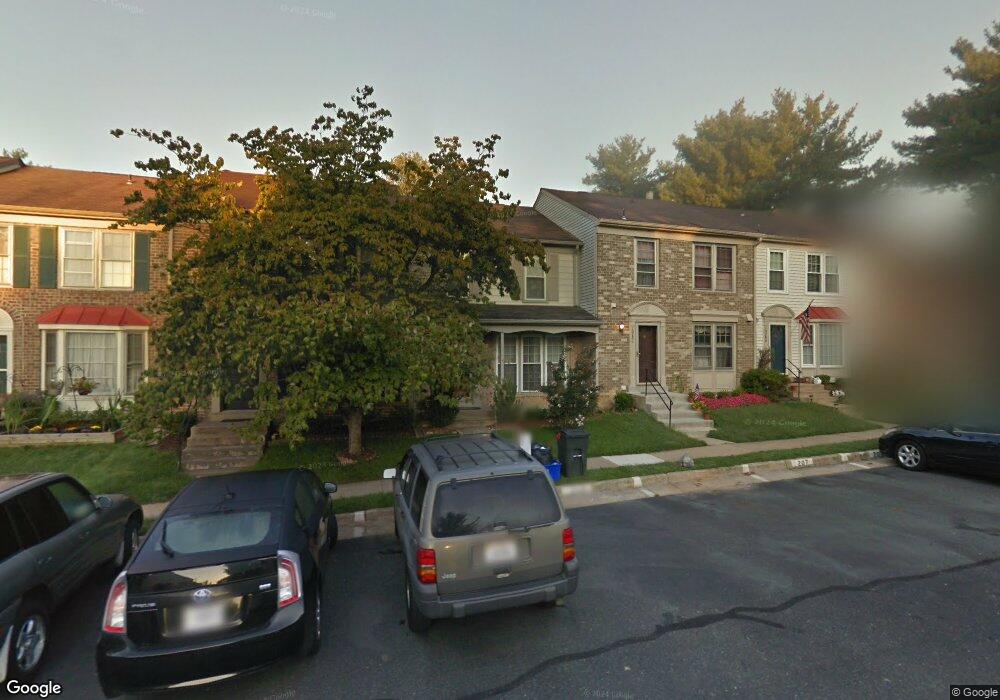
10286 Latney Rd Fairfax, VA 22032
Estimated Value: $589,000 - $595,000
3
Beds
4
Baths
1,280
Sq Ft
$463/Sq Ft
Est. Value
About This Home
This home is located at 10286 Latney Rd, Fairfax, VA 22032 and is currently estimated at $592,431, approximately $462 per square foot. 10286 Latney Rd is a home located in Fairfax County with nearby schools including Bonnie Brae Elementary School, James W Robinson, Jr. Secondary School, and Fairfax Baptist Temple Academy.
Ownership History
Date
Name
Owned For
Owner Type
Purchase Details
Closed on
Jun 1, 2020
Sold by
Rodriguez Mario and Rodriguez Maria E
Bought by
Rodriguez Maria E and Rodriguez Jenifer
Current Estimated Value
Home Financials for this Owner
Home Financials are based on the most recent Mortgage that was taken out on this home.
Original Mortgage
$176,000
Outstanding Balance
$156,011
Interest Rate
3.2%
Mortgage Type
New Conventional
Estimated Equity
$436,420
Purchase Details
Closed on
Jun 6, 1996
Sold by
Bui Dean
Bought by
Rodriguez Mario
Home Financials for this Owner
Home Financials are based on the most recent Mortgage that was taken out on this home.
Original Mortgage
$134,867
Interest Rate
7.89%
Purchase Details
Closed on
Mar 9, 1995
Sold by
Ahmadi Mohammad H
Bought by
Bui Dean
Home Financials for this Owner
Home Financials are based on the most recent Mortgage that was taken out on this home.
Original Mortgage
$96,693
Interest Rate
9.09%
Create a Home Valuation Report for This Property
The Home Valuation Report is an in-depth analysis detailing your home's value as well as a comparison with similar homes in the area
Home Values in the Area
Average Home Value in this Area
Purchase History
| Date | Buyer | Sale Price | Title Company |
|---|---|---|---|
| Rodriguez Maria E | -- | None Available | |
| Rodriguez Mario | $135,900 | -- | |
| Bui Dean | $135,000 | -- |
Source: Public Records
Mortgage History
| Date | Status | Borrower | Loan Amount |
|---|---|---|---|
| Open | Rodriguez Maria E | $176,000 | |
| Closed | Bui Dean | $134,867 | |
| Previous Owner | Bui Dean | $96,693 | |
| Closed | Bui Dean | $26,256 |
Source: Public Records
Tax History Compared to Growth
Tax History
| Year | Tax Paid | Tax Assessment Tax Assessment Total Assessment is a certain percentage of the fair market value that is determined by local assessors to be the total taxable value of land and additions on the property. | Land | Improvement |
|---|---|---|---|---|
| 2025 | $5,857 | $556,000 | $185,000 | $371,000 |
| 2024 | $5,857 | $505,600 | $165,000 | $340,600 |
| 2023 | $5,545 | $491,340 | $160,000 | $331,340 |
| 2022 | $5,166 | $451,780 | $140,000 | $311,780 |
| 2021 | $5,134 | $437,530 | $135,000 | $302,530 |
| 2020 | $5,135 | $386,070 | $115,000 | $271,070 |
| 2019 | $4,545 | $384,000 | $115,000 | $269,000 |
| 2018 | $4,324 | $375,980 | $110,000 | $265,980 |
| 2017 | $4,148 | $357,250 | $100,000 | $257,250 |
| 2016 | $4,049 | $349,540 | $95,000 | $254,540 |
| 2015 | $3,763 | $337,190 | $90,000 | $247,190 |
| 2014 | $3,672 | $329,740 | $85,000 | $244,740 |
Source: Public Records
Map
Nearby Homes
- 10343 Latney Rd
- 5515 Cheshire Meadows Way
- 10306 Hampshire Green Ave
- 10388 Hampshire Green Ave
- 10434 Calumet Grove Dr
- 5377 Laura Belle Ln
- 10412 Pearl St
- 5508 La Cross Ct
- 10449 Calumet Grove Dr
- 10402 Hollyoak Place
- 5503 Akridge Ct
- 5504 Winford Ct
- 5503 Fireside Ct
- 5811 Cove Landing Rd Unit 301
- 10330 Luria Commons Ct Unit 1B
- 5806 Cove Landing Rd Unit 304
- 5806 Cove Landing Rd Unit 101
- 10116 Dundalk St
- 5674 Oak Tanager Ct
- 10508 Indigo Ln
- 10288 Latney Rd
- 10284 Latney Rd
- 10290 Latney Rd
- 10282 Latney Rd
- 10292 Latney Rd
- 10294 Latney Rd
- 10308 Latney Rd
- 10306 Latney Rd
- 10304 Latney Rd
- 10310 Latney Rd
- 10296 Latney Rd
- 10302 Latney Rd
- 10278 Latney Rd
- 10300 Latney Rd
- 10276 Latney Rd
- 10312 Latney Rd
- 10274 Latney Rd
- 10298 Latney Rd
- 10314 Latney Rd
- 10262 Latney Rd