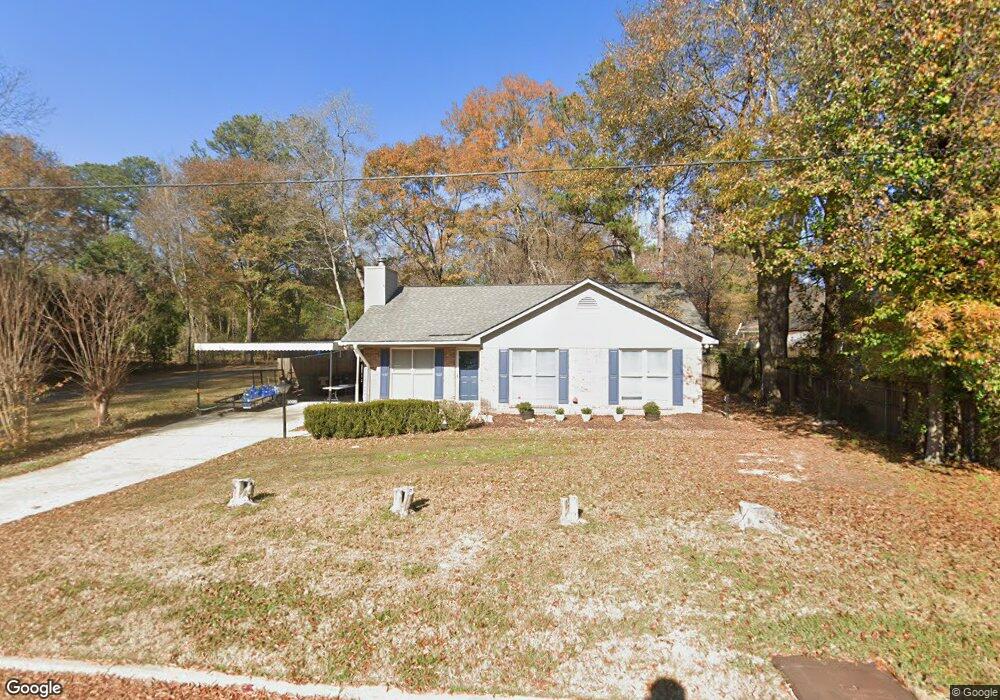
1029 53rd St Columbus, GA 31904
North Columbus NeighborhoodEstimated Value: $177,689 - $207,000
3
Beds
2
Baths
1,289
Sq Ft
$148/Sq Ft
Est. Value
About This Home
This home is located at 1029 53rd St, Columbus, GA 31904 and is currently estimated at $191,172, approximately $148 per square foot. 1029 53rd St is a home located in Muscogee County with nearby schools including River Road Elementary School, Arnold Middle School, and Jordan Vocational High School.
Ownership History
Date
Name
Owned For
Owner Type
Purchase Details
Closed on
Jul 2, 2020
Sold by
Henager James
Bought by
Ward Heather M and Ward Hunter M
Current Estimated Value
Home Financials for this Owner
Home Financials are based on the most recent Mortgage that was taken out on this home.
Original Mortgage
$125,265
Outstanding Balance
$111,077
Interest Rate
3.1%
Mortgage Type
FHA
Estimated Equity
$80,095
Purchase Details
Closed on
Sep 13, 2018
Sold by
Parish Devon J
Bought by
Henager James
Home Financials for this Owner
Home Financials are based on the most recent Mortgage that was taken out on this home.
Original Mortgage
$115,915
Interest Rate
4.5%
Mortgage Type
New Conventional
Purchase Details
Closed on
Aug 27, 2014
Sold by
Blair Kathy H
Bought by
Parish Devon J and Parish Alexandra
Home Financials for this Owner
Home Financials are based on the most recent Mortgage that was taken out on this home.
Original Mortgage
$110,832
Interest Rate
4.19%
Mortgage Type
VA
Purchase Details
Closed on
Jul 30, 2014
Sold by
Taylor Brooke N
Bought by
Blair Kathy H
Home Financials for this Owner
Home Financials are based on the most recent Mortgage that was taken out on this home.
Original Mortgage
$110,832
Interest Rate
4.19%
Mortgage Type
VA
Purchase Details
Closed on
Mar 28, 2011
Sold by
Blair Kathy H
Bought by
Blair Kathy H and Blair Taylor Brooke N
Create a Home Valuation Report for This Property
The Home Valuation Report is an in-depth analysis detailing your home's value as well as a comparison with similar homes in the area
Home Values in the Area
Average Home Value in this Area
Purchase History
| Date | Buyer | Sale Price | Title Company |
|---|---|---|---|
| Ward Heather M | $127,611 | -- | |
| Henager James | $119,500 | -- | |
| Parish Devon J | $108,500 | -- | |
| Blair Kathy H | -- | -- | |
| Blair Kathy H | -- | -- |
Source: Public Records
Mortgage History
| Date | Status | Borrower | Loan Amount |
|---|---|---|---|
| Open | Ward Heather M | $125,265 | |
| Previous Owner | Henager James | $115,915 | |
| Previous Owner | Parish Devon J | $110,832 |
Source: Public Records
Tax History
| Year | Tax Paid | Tax Assessment Tax Assessment Total Assessment is a certain percentage of the fair market value that is determined by local assessors to be the total taxable value of land and additions on the property. | Land | Improvement |
|---|---|---|---|---|
| 2025 | $1,467 | $60,592 | $9,476 | $51,116 |
| 2024 | $1,466 | $60,592 | $9,476 | $51,116 |
| 2023 | $781 | $60,592 | $9,476 | $51,116 |
| 2022 | $1,529 | $47,616 | $7,108 | $40,508 |
| 2021 | $1,522 | $50,668 | $7,108 | $43,560 |
| 2020 | $1,675 | $41,004 | $7,108 | $33,896 |
| 2019 | $1,680 | $41,004 | $7,108 | $33,896 |
| 2018 | $1,680 | $41,004 | $7,108 | $33,896 |
| 2017 | $1,685 | $41,004 | $7,108 | $33,896 |
| 2016 | $1,790 | $43,399 | $6,910 | $36,489 |
| 2015 | $1,792 | $43,399 | $6,910 | $36,489 |
| 2014 | $271 | $33,762 | $6,910 | $26,852 |
| 2013 | -- | $33,762 | $6,910 | $26,852 |
Source: Public Records
Map
Nearby Homes
- 1025 53rd St
- 5301 Morris Ave
- 1033 53rd St
- 5309 Morris Ave
- 1015 53rd St
- 5313 Morris Ave
- 5321 Morris Ave
- 1028 53rd St
- 5265 Morris Ave
- 1024 53rd St
- 1020 53rd St
- 5325 Morris Ave
- 5300 Thomason Ave
- 5257 Morris Ave
- 5304 Thomason Ave
- 5333 Morris Ave
- 5308 Morris Ave
- 5304 Morris Ave
- 5302 Thomason Ave
- 5312 Morris Ave
Your Personal Tour Guide
Ask me questions while you tour the home.