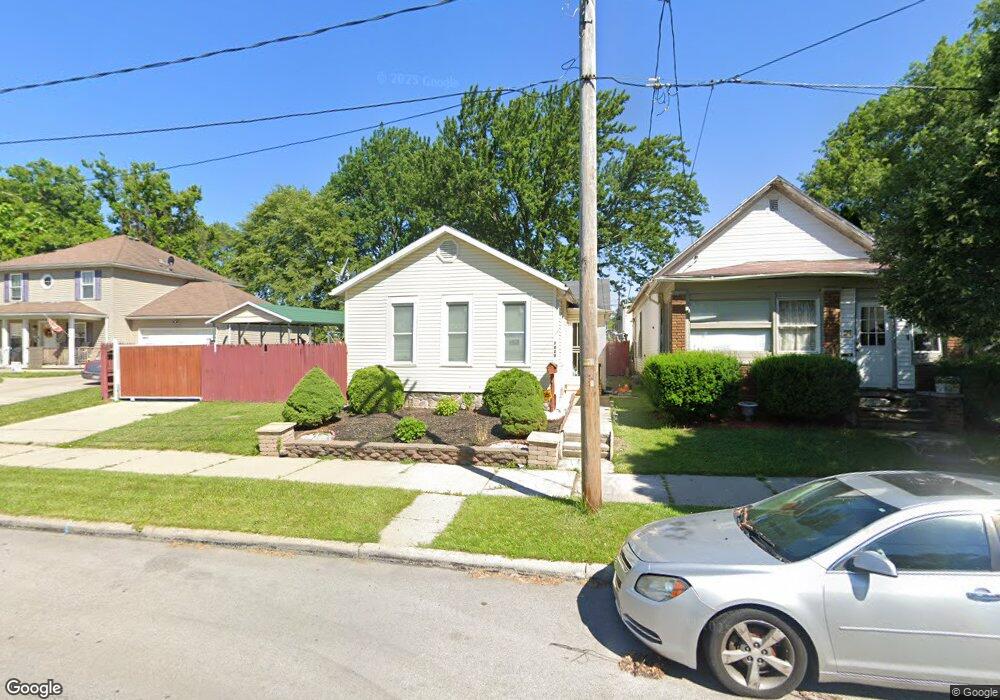
1029 Baker St Toledo, OH 43608
Lagrange NeighborhoodEstimated Value: $40,000 - $54,000
3
Beds
1
Bath
944
Sq Ft
$52/Sq Ft
Est. Value
About This Home
This home is located at 1029 Baker St, Toledo, OH 43608 and is currently estimated at $48,742, approximately $51 per square foot. 1029 Baker St is a home located in Lucas County with nearby schools including Sherman Elementary School, Woodward High School, and The Maritime Academy of Toledo.
Ownership History
Date
Name
Owned For
Owner Type
Purchase Details
Closed on
Nov 24, 2009
Sold by
Briones Maria M
Bought by
Cardiel Nunez Carlos
Current Estimated Value
Home Financials for this Owner
Home Financials are based on the most recent Mortgage that was taken out on this home.
Original Mortgage
$23,000
Interest Rate
4.95%
Mortgage Type
Seller Take Back
Purchase Details
Closed on
Nov 14, 2006
Sold by
Reca Lp
Bought by
Briones Maria Magdalena
Purchase Details
Closed on
Apr 5, 2004
Sold by
Citifinancial Mortgage Co Inc
Bought by
Reca Ltd Partnership
Purchase Details
Closed on
Sep 5, 2003
Sold by
Higgins Thomas H and Higgins Thelma P
Bought by
Citifinancial Mortgage Co Inc and Associates Home Equity Services Inc
Create a Home Valuation Report for This Property
The Home Valuation Report is an in-depth analysis detailing your home's value as well as a comparison with similar homes in the area
Home Values in the Area
Average Home Value in this Area
Purchase History
| Date | Buyer | Sale Price | Title Company |
|---|---|---|---|
| Cardiel Nunez Carlos | $27,000 | None Available | |
| Briones Maria Magdalena | $5,000 | None Available | |
| Reca Ltd Partnership | $5,000 | Sovereign Title Agency Llc | |
| Citifinancial Mortgage Co Inc | $16,000 | Sovereign Title Agency Llc |
Source: Public Records
Mortgage History
| Date | Status | Borrower | Loan Amount |
|---|---|---|---|
| Previous Owner | Cardiel Nunez Carlos | $23,000 |
Source: Public Records
Tax History Compared to Growth
Tax History
| Year | Tax Paid | Tax Assessment Tax Assessment Total Assessment is a certain percentage of the fair market value that is determined by local assessors to be the total taxable value of land and additions on the property. | Land | Improvement |
|---|---|---|---|---|
| 2024 | $282 | $7,175 | $1,750 | $5,425 |
| 2023 | $538 | $6,545 | $1,645 | $4,900 |
| 2022 | $539 | $6,545 | $1,645 | $4,900 |
| 2021 | $539 | $6,545 | $1,645 | $4,900 |
| 2020 | $519 | $5,495 | $1,365 | $4,130 |
| 2019 | $520 | $5,495 | $1,365 | $4,130 |
| 2018 | $509 | $5,495 | $1,365 | $4,130 |
| 2017 | $805 | $5,355 | $1,330 | $4,025 |
| 2016 | $521 | $15,300 | $3,800 | $11,500 |
| 2015 | $512 | $15,300 | $3,800 | $11,500 |
| 2014 | -- | $5,360 | $1,330 | $4,030 |
| 2013 | $337 | $5,360 | $1,330 | $4,030 |
Source: Public Records
Map
Nearby Homes