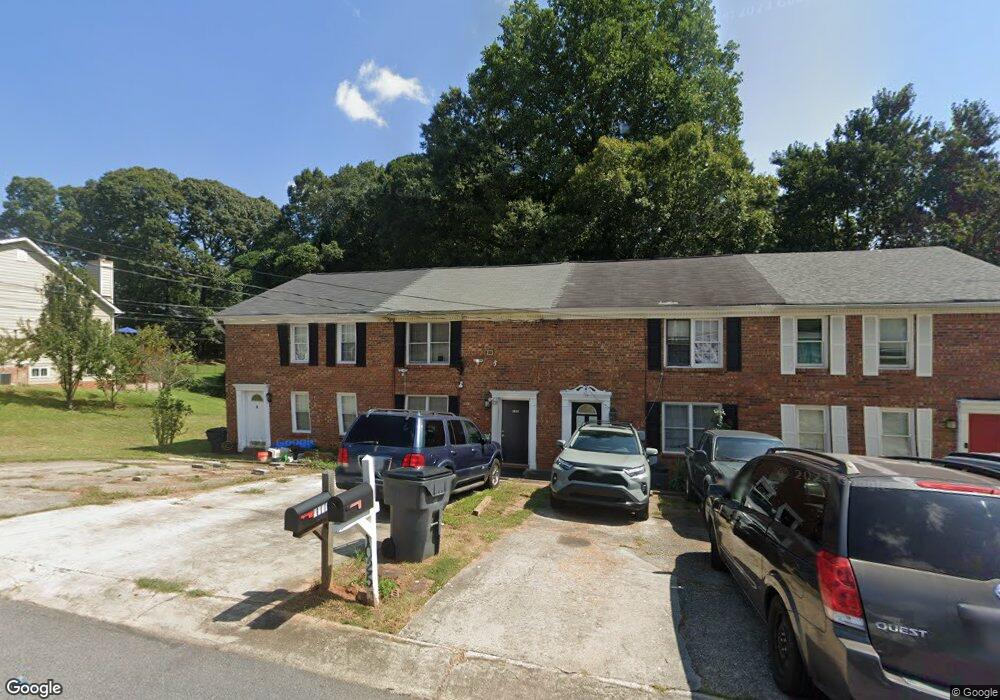
1029 Carla Place Unit 1029 Norcross, GA 30093
Estimated Value: $210,526 - $260,000
3
Beds
2
Baths
1,122
Sq Ft
$213/Sq Ft
Est. Value
About This Home
This home is located at 1029 Carla Place Unit 1029, Norcross, GA 30093 and is currently estimated at $239,382, approximately $213 per square foot. 1029 Carla Place Unit 1029 is a home located in Gwinnett County with nearby schools including Minor Elementary School, Berkmar Middle School, and Berkmar High School.
Ownership History
Date
Name
Owned For
Owner Type
Purchase Details
Closed on
Mar 8, 2011
Sold by
Hsbc Bank Series 2007-Af1
Bought by
Jaro Jarvin and Jaro Lillian
Current Estimated Value
Purchase Details
Closed on
Nov 2, 2010
Sold by
Zhang Ying
Bought by
Hsbc Bank Usa Series 2007-Af1
Purchase Details
Closed on
Aug 14, 2006
Sold by
Secretary Of Hud
Bought by
Zhang Ying
Purchase Details
Closed on
Mar 7, 2006
Sold by
Washington Mutual Bk
Bought by
Secretary Of Hud
Purchase Details
Closed on
Oct 30, 1997
Sold by
Herrera Jose M
Bought by
Williams Deatrice A
Home Financials for this Owner
Home Financials are based on the most recent Mortgage that was taken out on this home.
Original Mortgage
$54,806
Interest Rate
7.31%
Mortgage Type
FHA
Create a Home Valuation Report for This Property
The Home Valuation Report is an in-depth analysis detailing your home's value as well as a comparison with similar homes in the area
Home Values in the Area
Average Home Value in this Area
Purchase History
| Date | Buyer | Sale Price | Title Company |
|---|---|---|---|
| Jaro Jarvin | $18,500 | -- | |
| Hsbc Bank Usa Series 2007-Af1 | $24,000 | -- | |
| Zhang Ying | -- | -- | |
| Secretary Of Hud | -- | -- | |
| Washington Mutual Bk | $61,634 | -- | |
| Williams Deatrice A | $54,900 | -- |
Source: Public Records
Mortgage History
| Date | Status | Borrower | Loan Amount |
|---|---|---|---|
| Previous Owner | Williams Deatrice A | $54,806 |
Source: Public Records
Tax History Compared to Growth
Tax History
| Year | Tax Paid | Tax Assessment Tax Assessment Total Assessment is a certain percentage of the fair market value that is determined by local assessors to be the total taxable value of land and additions on the property. | Land | Improvement |
|---|---|---|---|---|
| 2024 | $3,153 | $80,520 | $18,000 | $62,520 |
| 2023 | $3,153 | $69,400 | $10,800 | $58,600 |
| 2022 | $2,719 | $69,400 | $10,800 | $58,600 |
| 2021 | $1,529 | $35,520 | $7,200 | $28,320 |
| 2020 | $1,484 | $35,520 | $7,200 | $28,320 |
| 2019 | $1,484 | $35,520 | $7,200 | $28,320 |
| 2018 | $1,478 | $35,520 | $7,200 | $28,320 |
| 2016 | $929 | $19,320 | $4,400 | $14,920 |
| 2015 | $940 | $19,320 | $4,400 | $14,920 |
| 2014 | -- | $8,480 | $1,600 | $6,880 |
Source: Public Records
Map
Nearby Homes
- 1146 Samuel Dr
- 1151 Overland Hill Trace
- 4059 Heritage Valley Ct
- 4017 Heritage Valley Ct
- 918 Hampton Trail NW
- 881 Huntington Way NW
- 1331 Sweet Pine Dr
- 4450 Bradstone Trace NW Unit 2
- 4446 Arcadia Dr
- 3826 Green Bay Dr Unit 2
- 4453 Freeman Ct Unit 1
- 4092 Anvil Ct Unit 2
- 3951 Millwood Ln NW
- 3955 Peninsula Ct
- 3911 Millwood Ln NW
- 1432 Shenta Oak Dr
- 1118 Saybrook Cir NW
- 4474 Casco Ln NW
- 3975 Bradstone Trace NW
- 1029 Carla Place
- 1025 Carla Place Unit 3
- 1033 Carla Place
- 1033 Carla Place Unit 1033
- 1021 Carla Place
- 1017 Carla Place
- 1037 Carla Place
- 1013 Carla Place
- 1009 Carla Place
- 1005 Carla Place Unit 3
- 1001 Carla Place
- 1022 Carla Place
- 1022 Carla Place Unit 1022
- 1012 Carla Place
- 997 Carla Place Unit 997
- 997 Carla Place
- 997 Carla Place Unit 3
- 1032 Carla Place
- 1002 Carla Place Unit 3
- 993 Carla Place