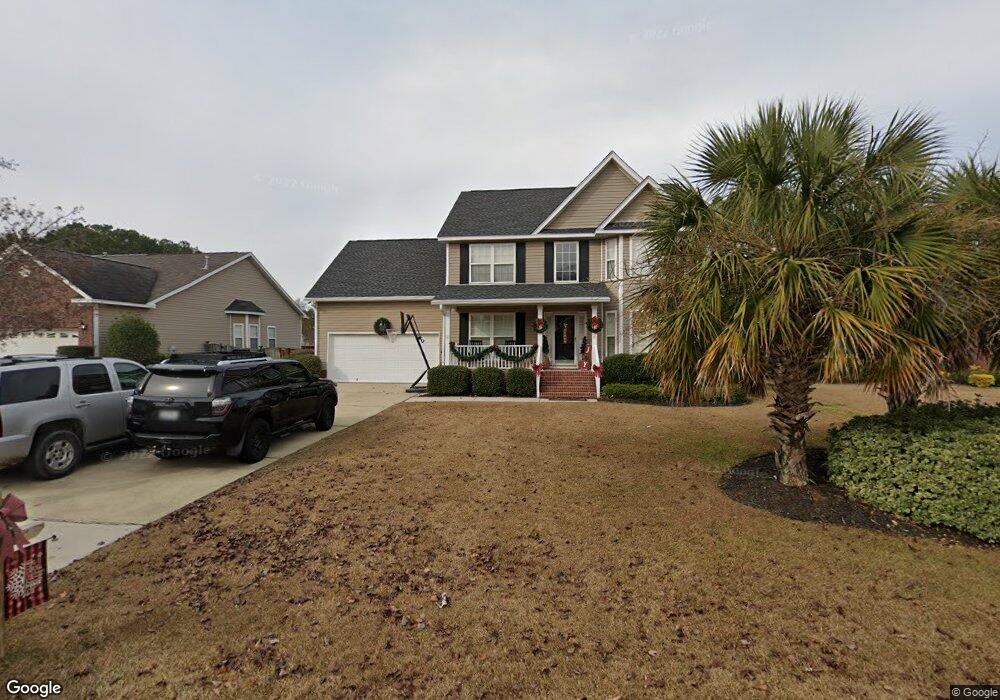
1029 Crestwater Ct West Columbia, SC 29169
Estimated Value: $338,697 - $433,000
3
Beds
5
Baths
2,454
Sq Ft
$155/Sq Ft
Est. Value
About This Home
This home is located at 1029 Crestwater Ct, West Columbia, SC 29169 and is currently estimated at $380,924, approximately $155 per square foot. 1029 Crestwater Ct is a home located in Lexington County with nearby schools including Saluda River Academy For The Arts, Northside Middle, and Brookland-Cayce High School.
Ownership History
Date
Name
Owned For
Owner Type
Purchase Details
Closed on
Dec 27, 2017
Sold by
Huffman John and Huffman Anna
Bought by
Huffman Anna M
Current Estimated Value
Home Financials for this Owner
Home Financials are based on the most recent Mortgage that was taken out on this home.
Original Mortgage
$196,000
Outstanding Balance
$165,316
Interest Rate
3.92%
Mortgage Type
New Conventional
Estimated Equity
$215,608
Purchase Details
Closed on
Nov 5, 2012
Sold by
Stanley Tara R and Bailey Tara Rhea
Bought by
Stanley Kenneth L
Home Financials for this Owner
Home Financials are based on the most recent Mortgage that was taken out on this home.
Original Mortgage
$75,000
Interest Rate
3.4%
Mortgage Type
Future Advance Clause Open End Mortgage
Purchase Details
Closed on
Feb 9, 2011
Sold by
Bailey Winifred Ann
Bought by
Wamb Enterprises Llc
Create a Home Valuation Report for This Property
The Home Valuation Report is an in-depth analysis detailing your home's value as well as a comparison with similar homes in the area
Home Values in the Area
Average Home Value in this Area
Purchase History
| Date | Buyer | Sale Price | Title Company |
|---|---|---|---|
| Huffman Anna M | -- | None Available | |
| Stanley Kenneth L | -- | -- | |
| Wamb Enterprises Llc | -- | -- |
Source: Public Records
Mortgage History
| Date | Status | Borrower | Loan Amount |
|---|---|---|---|
| Open | Huffman Anna M | $196,000 | |
| Closed | Stanley Kenneth L | $75,000 |
Source: Public Records
Tax History Compared to Growth
Tax History
| Year | Tax Paid | Tax Assessment Tax Assessment Total Assessment is a certain percentage of the fair market value that is determined by local assessors to be the total taxable value of land and additions on the property. | Land | Improvement |
|---|---|---|---|---|
| 2024 | $1,763 | $8,323 | $1,600 | $6,723 |
| 2023 | $1,590 | $8,323 | $1,600 | $6,723 |
| 2022 | $1,605 | $8,323 | $1,600 | $6,723 |
| 2020 | $1,542 | $8,323 | $1,600 | $6,723 |
| 2019 | $1,558 | $8,240 | $1,400 | $6,840 |
| 2018 | $1,574 | $8,240 | $1,400 | $6,840 |
| 2017 | $1,511 | $8,240 | $1,400 | $6,840 |
| 2016 | $1,554 | $8,240 | $1,400 | $6,840 |
| 2014 | $1,182 | $8,240 | $1,400 | $6,840 |
| 2013 | -- | $8,630 | $920 | $7,710 |
Source: Public Records
Map
Nearby Homes
- 1500 Redwood Dr
- 1509 Goldfinch Ln
- 1540 Sewanee Dr
- 292 Marabou Cir
- 1711 Holly Hill Dr
- 0 Sunset Blvd Unit 553428
- 100 Double Branch Ct
- 0 Terrace View Dr
- 318 Skipperling Ln
- 1715 Gilvie Ave
- 500 Finnegan Ln
- 929-931 Central Dr
- 55 Holly Ridge Ln
- 529 Finnegan Ln
- 175 Hulon Greene Place Unit 3
- 1100 Seminole Dr
- 7 Janice Fe Trail
- 13 Janice Fe Trail
- 21 Janice Fe Trail
- 623 Hook Ave
- 1025 Crestwater Ct
- 1033 Crestwater Ct
- 1021 Crestwater Ct
- 1030 Riverstone Ct
- 1034 Riverstone Ct
- 1017 Crestwater Ct
- 1028 Crestwater Ct
- 1032 Crestwater Ct
- 1024 Riverstone Ct
- 1024 Crestwater Ct
- 1043 Crestwater Ct
- 1020 Riverstone Ct
- 1037 Riverstone Ct
- 1036 Crestwater Ct
- 1013 Crestwater Ct
- 1020 Crestwater Ct
- 1016 Riverstone Ct
- 1040 Crestwater Ct
- 1016 Crestwater Ct
- 1033 Riverstone Ct