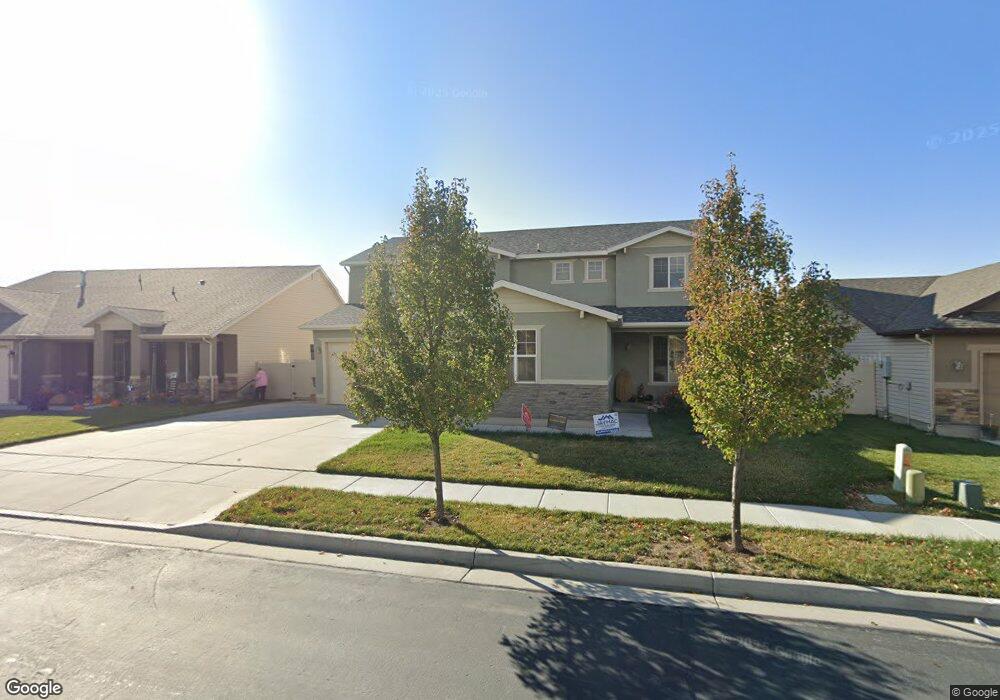
1029 Danby Dr North Salt Lake, UT 84054
Estimated Value: $674,000 - $808,000
6
Beds
4
Baths
3,182
Sq Ft
$225/Sq Ft
Est. Value
About This Home
This home is located at 1029 Danby Dr, North Salt Lake, UT 84054 and is currently estimated at $715,695, approximately $224 per square foot. 1029 Danby Dr is a home located in Davis County with nearby schools including Foxboro School, Mueller Park Junior High School, and Bountiful High School.
Ownership History
Date
Name
Owned For
Owner Type
Purchase Details
Closed on
Jun 23, 2021
Sold by
Patel Damyantlben Bhavan
Bought by
Rushton Timothy H and Rushton Sondra C
Current Estimated Value
Home Financials for this Owner
Home Financials are based on the most recent Mortgage that was taken out on this home.
Original Mortgage
$496,000
Outstanding Balance
$449,066
Interest Rate
2.9%
Mortgage Type
New Conventional
Estimated Equity
$266,629
Purchase Details
Closed on
Nov 20, 2012
Sold by
Foxboro Estates Llc
Bought by
Patel Bhavan and Patel Damyantiben Bhavan
Home Financials for this Owner
Home Financials are based on the most recent Mortgage that was taken out on this home.
Original Mortgage
$326,962
Interest Rate
3.35%
Mortgage Type
New Conventional
Create a Home Valuation Report for This Property
The Home Valuation Report is an in-depth analysis detailing your home's value as well as a comparison with similar homes in the area
Home Values in the Area
Average Home Value in this Area
Purchase History
| Date | Buyer | Sale Price | Title Company |
|---|---|---|---|
| Rushton Timothy H | -- | Old Republic National Title | |
| Patel Bhavan | -- | None Available | |
| Patel Damyantiben Bhavan | -- | Us Title Company Of |
Source: Public Records
Mortgage History
| Date | Status | Borrower | Loan Amount |
|---|---|---|---|
| Open | Rushton Timothy H | $496,000 | |
| Previous Owner | Patel Damyantiben Bhavan | $326,962 |
Source: Public Records
Tax History Compared to Growth
Tax History
| Year | Tax Paid | Tax Assessment Tax Assessment Total Assessment is a certain percentage of the fair market value that is determined by local assessors to be the total taxable value of land and additions on the property. | Land | Improvement |
|---|---|---|---|---|
| 2025 | $3,390 | $350,350 | $106,265 | $244,085 |
| 2024 | $3,390 | $341,000 | $112,232 | $228,768 |
| 2023 | $3,305 | $601,000 | $147,762 | $453,238 |
| 2022 | $3,526 | $352,000 | $64,275 | $287,725 |
| 2021 | $3,122 | $473,000 | $94,197 | $378,803 |
| 2020 | $2,783 | $417,000 | $80,210 | $336,790 |
| 2019 | $2,840 | $415,000 | $62,828 | $352,172 |
| 2018 | $2,650 | $383,000 | $57,117 | $325,883 |
| 2016 | $2,491 | $191,510 | $31,414 | $160,096 |
| 2015 | $2,382 | $175,945 | $31,414 | $144,531 |
| 2014 | $2,337 | $175,896 | $31,414 | $144,482 |
| 2013 | -- | $148,126 | $29,138 | $118,988 |
Source: Public Records
Map
Nearby Homes
- 997 N Fox Hollow Dr
- 1052 Chidester Dr
- 997 Amberly Dr
- 967 Amberly Dr
- 1150 Wiltshire Dr
- 1147 Abbotsford Dr
- 1022 Allington Dr
- 1002 W Stonehaven Dr Unit 108
- 1074 Allington Dr
- 928 Amberly Dr
- 940 W Stonehaven Dr
- 1072 W Stonehaven Dr
- 920 W Stonehaven Dr
- 942 N Abbey Dr
- 1147 Ethnie Ct
- Somerset B Plan at Clifton Place Townhomes
- Somerset A Plan at Clifton Place Townhomes
- Camden Plan at Clifton Place Townhomes
- Charleston Plan at Clifton Place Townhomes
- Kensington Plan at Clifton Place Townhomes
- 1037 Danby Dr
- 1017 Danby Dr
- 1024 N Fox Hollow Dr
- 1026 N Fox Hollow Dr
- 1047 Danby Dr
- 1014 N Fox Hollow Dr
- 1011 Danby Dr
- 1046 N Fox Hollow Dr
- 1032 Danby Dr
- 1024 Danby Dr
- 1042 Danby Dr
- 1002 N Fox Hollow Dr
- 1058 N Fox Hollow Dr
- 1055 Danby Dr
- 1014 Danby Dr
- 1052 Danby Dr
- 1037 Newham Ct
- 1062 N Fox Hollow Dr
- 1023 N Fox Hollow Dr
- 1062 N Fox Hollow Dr