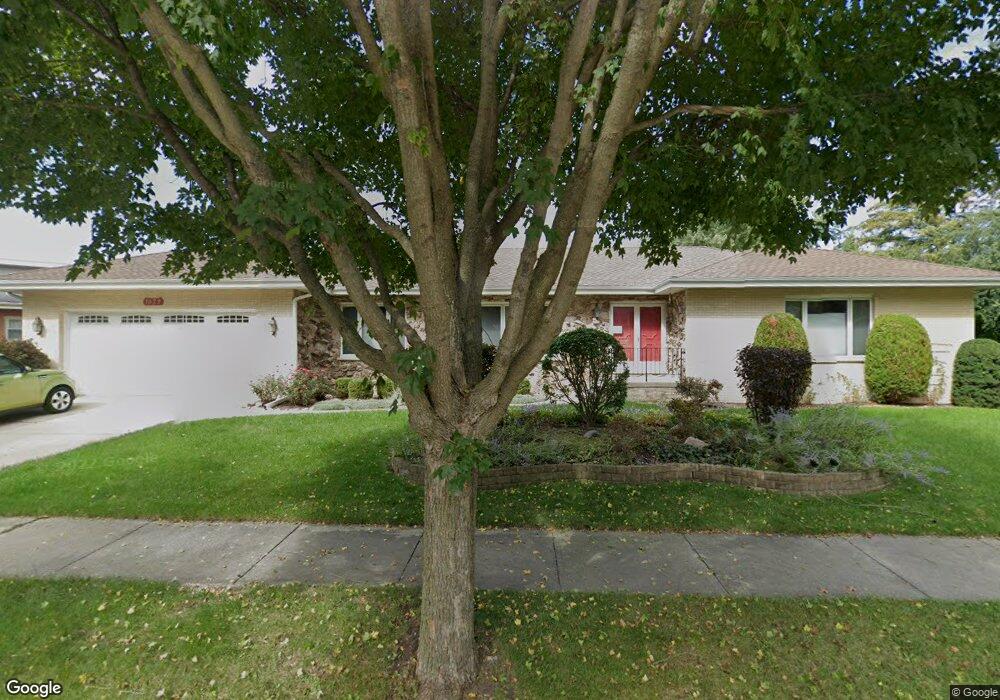
1029 Devonshire Ct Highland Park, IL 60035
West Highland Park NeighborhoodEstimated Value: $578,000 - $702,000
--
Bed
3
Baths
2,141
Sq Ft
$295/Sq Ft
Est. Value
About This Home
This home is located at 1029 Devonshire Ct, Highland Park, IL 60035 and is currently estimated at $631,262, approximately $294 per square foot. 1029 Devonshire Ct is a home located in Lake County with nearby schools including Kipling Elementary School, Alan B Shepard Middle School, and Deerfield High School.
Ownership History
Date
Name
Owned For
Owner Type
Purchase Details
Closed on
Aug 12, 2017
Sold by
Suszek Robert J and Pighetti Angela
Bought by
Suszek Robert J and Suszek Angela A P
Current Estimated Value
Home Financials for this Owner
Home Financials are based on the most recent Mortgage that was taken out on this home.
Original Mortgage
$180,000
Outstanding Balance
$122,399
Interest Rate
3.62%
Mortgage Type
New Conventional
Estimated Equity
$508,863
Purchase Details
Closed on
Nov 5, 2002
Sold by
Pighetti Victor
Bought by
Suszek Robert J
Home Financials for this Owner
Home Financials are based on the most recent Mortgage that was taken out on this home.
Original Mortgage
$120,000
Interest Rate
6%
Purchase Details
Closed on
Sep 19, 2000
Sold by
Pighetti Victor and Pighetti Quinta
Bought by
Pighetti Angela and Pighetti Victor
Home Financials for this Owner
Home Financials are based on the most recent Mortgage that was taken out on this home.
Original Mortgage
$65,000
Interest Rate
7.98%
Mortgage Type
Seller Take Back
Create a Home Valuation Report for This Property
The Home Valuation Report is an in-depth analysis detailing your home's value as well as a comparison with similar homes in the area
Home Values in the Area
Average Home Value in this Area
Purchase History
| Date | Buyer | Sale Price | Title Company |
|---|---|---|---|
| Suszek Robert J | -- | Acquest Title Services Llc | |
| Suszek Robert J | $330,000 | Chicago Title Insurance Co | |
| Pighetti Angela | -- | Chicago Title Insurance Co |
Source: Public Records
Mortgage History
| Date | Status | Borrower | Loan Amount |
|---|---|---|---|
| Open | Suszek Robert J | $180,000 | |
| Previous Owner | Suszek Robert J | $120,000 | |
| Previous Owner | Pighetti Angela | $65,000 |
Source: Public Records
Tax History Compared to Growth
Tax History
| Year | Tax Paid | Tax Assessment Tax Assessment Total Assessment is a certain percentage of the fair market value that is determined by local assessors to be the total taxable value of land and additions on the property. | Land | Improvement |
|---|---|---|---|---|
| 2024 | $11,596 | $154,198 | $51,746 | $102,452 |
| 2023 | $13,604 | $138,992 | $46,643 | $92,349 |
| 2022 | $13,604 | $157,998 | $51,240 | $106,758 |
| 2021 | $12,847 | $152,729 | $49,531 | $103,198 |
| 2020 | $12,374 | $152,729 | $49,531 | $103,198 |
| 2019 | $11,925 | $152,014 | $49,299 | $102,715 |
| 2018 | $10,378 | $138,778 | $54,589 | $84,189 |
| 2017 | $10,263 | $137,978 | $54,274 | $83,704 |
| 2016 | $9,863 | $131,358 | $51,670 | $79,688 |
| 2015 | $9,515 | $122,046 | $48,007 | $74,039 |
| 2014 | $9,701 | $119,590 | $43,146 | $76,444 |
| 2012 | $10,161 | $120,288 | $43,398 | $76,890 |
Source: Public Records
Map
Nearby Homes
- 810 Virginia Rd
- 1039 Deerfield Place Unit 1039
- 850 Evergreen Way
- 1075 Heather Rd
- 666 Barberry Rd
- 1490 Avignon Ct
- 805 Brand Ln
- 1491 Deerfield Place
- 717 Brierhill Rd
- 1816 Rosemary Rd
- 1381 Sunnyside Ave
- 1672 Huntington Ln
- 513 Sumac Rd
- 1263 Carlisle Place
- 1615 Robin Hood Place
- 1341 Carlisle Place
- 1020 Deerfield Rd Unit 1020
- 1127 Kenton Rd
- 860 Kenton Rd
- 757 Kipling Place
- 1035 Devonshire Ct
- 1024 Ridge Rd
- 1039 Devonshire Ct
- 1022 Ridge Rd
- 1028 Ridge Rd
- 1036 Devonshire Ct
- 1030 Ridge Rd
- 1042 Devonshire Ct
- 1028 Devonshire Ct
- 1018 Ridge Rd
- 1041 Devonshire Ct
- 1024 Devonshire Ct
- 1032 Ridge Rd
- 1045 Devonshire Ct
- 1018 Devonshire Ct
- 1036 Ridge Rd
- 1016 Devonshire Ct
- 1049 Devonshire Ct
- 1755 Heather Ln
- 1038 Ridge Rd