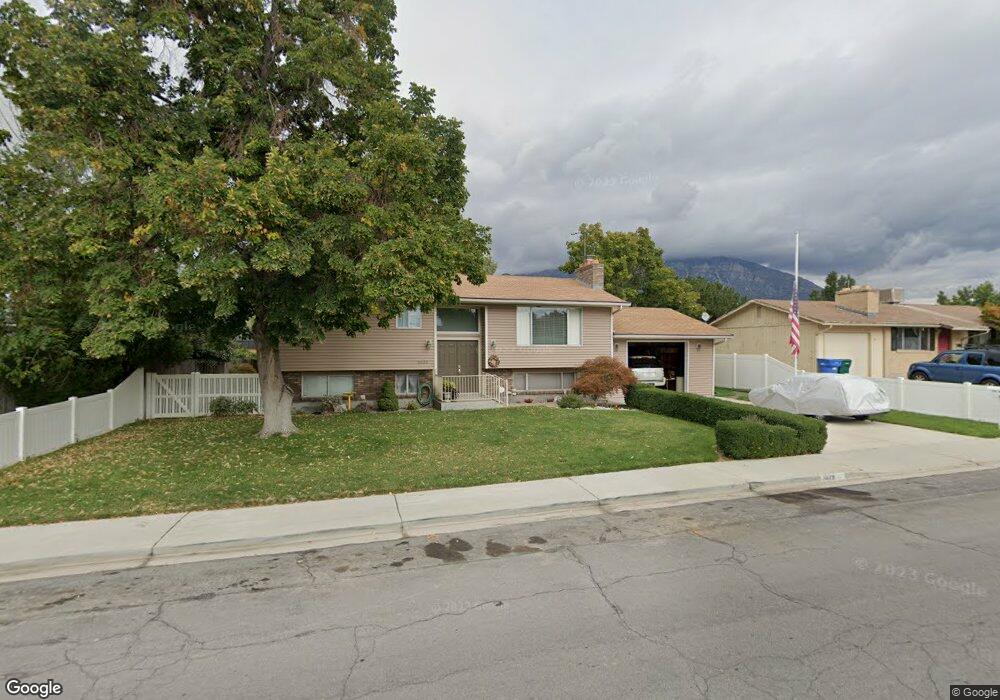
1029 E 500 N Orem, UT 84097
Orchard South NeighborhoodEstimated Value: $475,000 - $495,254
3
Beds
1
Bath
1,080
Sq Ft
$452/Sq Ft
Est. Value
About This Home
This home is located at 1029 E 500 N, Orem, UT 84097 and is currently estimated at $488,418, approximately $452 per square foot. 1029 E 500 N is a home located in Utah County with nearby schools including Foothill Elementary School, Canyon View Junior High School, and Orem High School.
Ownership History
Date
Name
Owned For
Owner Type
Purchase Details
Closed on
Jan 11, 2011
Sold by
Hummell Linda Cluff
Bought by
Edwards Linda Marie and Linda Marie Edwards Trust
Current Estimated Value
Purchase Details
Closed on
May 27, 2010
Sold by
Edwards Randy Dale
Bought by
Edwards Randy Dale
Home Financials for this Owner
Home Financials are based on the most recent Mortgage that was taken out on this home.
Original Mortgage
$21,535
Interest Rate
5.03%
Mortgage Type
New Conventional
Purchase Details
Closed on
Mar 7, 2003
Sold by
Hummell Linda and Hummell Linda C
Bought by
Hummell Linda Cluff and Linda C Hummell Trust
Create a Home Valuation Report for This Property
The Home Valuation Report is an in-depth analysis detailing your home's value as well as a comparison with similar homes in the area
Home Values in the Area
Average Home Value in this Area
Purchase History
| Date | Buyer | Sale Price | Title Company |
|---|---|---|---|
| Edwards Linda Marie | -- | None Available | |
| Edwards Randy Dale | -- | Accommodation | |
| Edwards Randy Dale | -- | Accommodation | |
| Hummell Linda Cluff | -- | -- |
Source: Public Records
Mortgage History
| Date | Status | Borrower | Loan Amount |
|---|---|---|---|
| Previous Owner | Edwards Randy Dale | $21,535 |
Source: Public Records
Tax History
| Year | Tax Paid | Tax Assessment Tax Assessment Total Assessment is a certain percentage of the fair market value that is determined by local assessors to be the total taxable value of land and additions on the property. | Land | Improvement |
|---|---|---|---|---|
| 2025 | $75 | $244,090 | -- | -- |
| 2024 | $75 | $233,420 | $0 | $0 |
| 2023 | $166 | $232,155 | $0 | $0 |
| 2022 | $302 | $248,490 | $0 | $0 |
| 2021 | $23 | $313,000 | $149,100 | $163,900 |
| 2020 | $127 | $280,000 | $119,300 | $160,700 |
| 2019 | $1,367 | $269,500 | $108,800 | $160,700 |
| 2018 | $176 | $245,000 | $105,300 | $139,700 |
| 2017 | $1,179 | $118,910 | $0 | $0 |
| 2016 | $46 | $104,775 | $0 | $0 |
| 2015 | $55 | $98,065 | $0 | $0 |
| 2014 | $24 | $94,710 | $0 | $0 |
Source: Public Records
Map
Nearby Homes
Your Personal Tour Guide
Ask me questions while you tour the home.