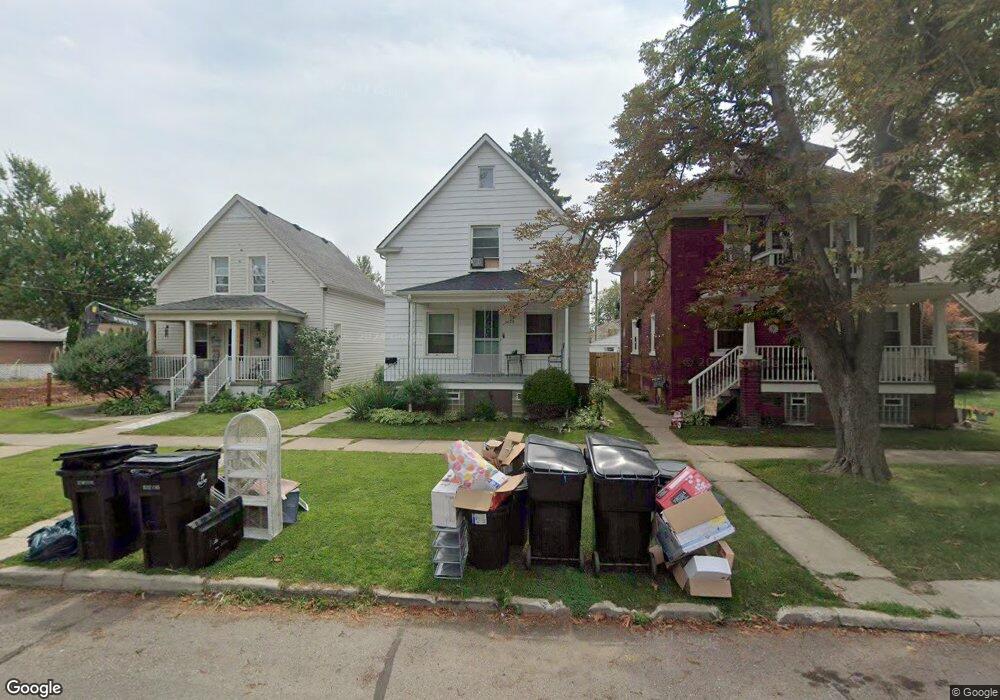
1029 Elm St Wyandotte, MI 48192
Estimated Value: $155,000 - $186,000
4
Beds
1
Bath
1,155
Sq Ft
$150/Sq Ft
Est. Value
About This Home
This home is located at 1029 Elm St, Wyandotte, MI 48192 and is currently estimated at $172,817, approximately $149 per square foot. 1029 Elm St is a home located in Wayne County with nearby schools including Washington Elementary School, Woodrow Wilson School, and Roosevelt High School.
Ownership History
Date
Name
Owned For
Owner Type
Purchase Details
Closed on
Nov 22, 2010
Sold by
The William F Jordan & Glenna Jordan Rev
Bought by
Esquivel Juan and Esquivel Courtney
Current Estimated Value
Home Financials for this Owner
Home Financials are based on the most recent Mortgage that was taken out on this home.
Original Mortgage
$32,400
Interest Rate
4.53%
Mortgage Type
Seller Take Back
Purchase Details
Closed on
Nov 21, 2007
Sold by
Jordan William F and Jordan Glenna Lou
Bought by
William F and William Glenna Jordan
Create a Home Valuation Report for This Property
The Home Valuation Report is an in-depth analysis detailing your home's value as well as a comparison with similar homes in the area
Home Values in the Area
Average Home Value in this Area
Purchase History
| Date | Buyer | Sale Price | Title Company |
|---|---|---|---|
| Esquivel Juan | $39,900 | Michigan Title Insurance Age | |
| William F | -- | None Available |
Source: Public Records
Mortgage History
| Date | Status | Borrower | Loan Amount |
|---|---|---|---|
| Closed | Esquivel Juan | $32,400 |
Source: Public Records
Tax History Compared to Growth
Tax History
| Year | Tax Paid | Tax Assessment Tax Assessment Total Assessment is a certain percentage of the fair market value that is determined by local assessors to be the total taxable value of land and additions on the property. | Land | Improvement |
|---|---|---|---|---|
| 2025 | $1,945 | $72,800 | $0 | $0 |
| 2024 | $1,945 | $70,400 | $0 | $0 |
| 2023 | $1,855 | $65,000 | $0 | $0 |
| 2022 | $2,384 | $53,500 | $0 | $0 |
| 2021 | $2,540 | $51,800 | $0 | $0 |
| 2020 | $2,297 | $46,100 | $0 | $0 |
| 2019 | $2,616 | $40,800 | $0 | $0 |
| 2018 | $1,631 | $35,100 | $0 | $0 |
| 2017 | $1,102 | $35,100 | $0 | $0 |
| 2016 | $2,116 | $32,500 | $0 | $0 |
| 2015 | $2,849 | $30,200 | $0 | $0 |
| 2013 | $2,760 | $27,600 | $0 | $0 |
| 2012 | $1,574 | $28,900 | $6,400 | $22,500 |
Source: Public Records
Map
Nearby Homes