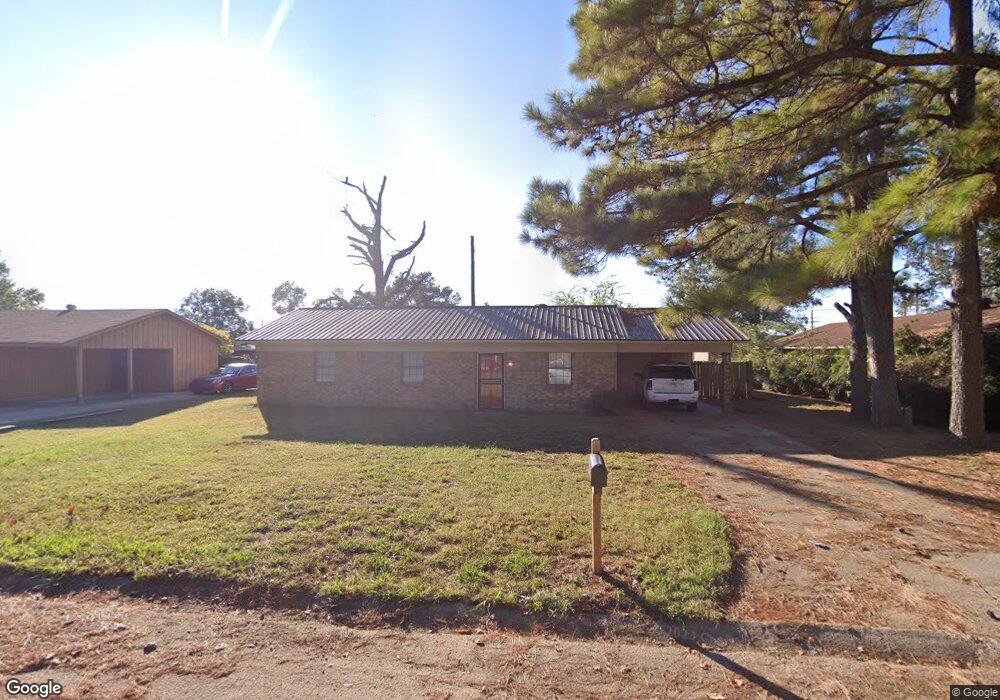
1029 Fordham St Forrest City, AR 72335
Estimated Value: $84,024 - $95,000
--
Bed
1
Bath
1,168
Sq Ft
$76/Sq Ft
Est. Value
About This Home
This home is located at 1029 Fordham St, Forrest City, AR 72335 and is currently estimated at $88,756, approximately $75 per square foot. 1029 Fordham St is a home located in St. Francis County with nearby schools including Central Elementary School, Stewart Elementary School, and Forrest City Junior High School.
Ownership History
Date
Name
Owned For
Owner Type
Purchase Details
Closed on
Feb 10, 2023
Sold by
Hastings Ritchie D
Bought by
Murphy Darlean T
Current Estimated Value
Home Financials for this Owner
Home Financials are based on the most recent Mortgage that was taken out on this home.
Original Mortgage
$81,600
Outstanding Balance
$78,941
Interest Rate
6.12%
Mortgage Type
New Conventional
Estimated Equity
$9,815
Purchase Details
Closed on
Jun 6, 2014
Bought by
Hastings Ritchie D
Purchase Details
Closed on
Oct 15, 2013
Sold by
Lynch Marilyn
Bought by
Jpmorgan Chase Bank Na
Purchase Details
Closed on
Sep 28, 1998
Sold by
Not Provided
Bought by
Lynch Marilyn
Purchase Details
Closed on
May 31, 1988
Bought by
Act 1063-1985 Divorce
Purchase Details
Closed on
Dec 1, 1980
Bought by
Hobson
Create a Home Valuation Report for This Property
The Home Valuation Report is an in-depth analysis detailing your home's value as well as a comparison with similar homes in the area
Home Values in the Area
Average Home Value in this Area
Purchase History
| Date | Buyer | Sale Price | Title Company |
|---|---|---|---|
| Murphy Darlean T | $85,000 | Cowling Title | |
| Hastings Ritchie D | -- | -- | |
| Hastings Ritchie D | $19,000 | None Available | |
| Jpmorgan Chase Bank Na | $51,287 | None Available | |
| Lynch Marilyn | $30,000 | -- | |
| Act 1063-1985 Divorce | -- | -- | |
| Hobson | -- | -- |
Source: Public Records
Mortgage History
| Date | Status | Borrower | Loan Amount |
|---|---|---|---|
| Open | Murphy Darlean T | $81,600 |
Source: Public Records
Tax History Compared to Growth
Tax History
| Year | Tax Paid | Tax Assessment Tax Assessment Total Assessment is a certain percentage of the fair market value that is determined by local assessors to be the total taxable value of land and additions on the property. | Land | Improvement |
|---|---|---|---|---|
| 2024 | $515 | $11,120 | $1,600 | $9,520 |
| 2023 | $486 | $11,120 | $1,600 | $9,520 |
| 2022 | $446 | $11,120 | $1,600 | $9,520 |
| 2021 | $414 | $8,930 | $1,600 | $7,330 |
| 2020 | $414 | $8,930 | $1,600 | $7,330 |
| 2019 | $423 | $8,930 | $1,600 | $7,330 |
| 2018 | $423 | $8,930 | $1,600 | $7,330 |
| 2017 | $413 | $8,930 | $1,600 | $7,330 |
| 2016 | $463 | $10,000 | $1,600 | $8,400 |
| 2015 | $463 | $10,000 | $1,600 | $8,400 |
| 2014 | $463 | $10,000 | $1,600 | $8,400 |
Source: Public Records
Map
Nearby Homes
- 1006 Hickey St
- 1031 Cherry St
- 947 Cherry St
- 717 Laughrun Dr
- 1110 N Division St
- 424 Beech Grove Dr
- 1047 N Rosser St
- 1047 N Rosser St Unit 122 E Arkansas Avenu
- 423 Laughrun Dr
- 226 Oak Ave
- 1030 N Izard St
- 1108 N Izard St
- 319 Mississippi St
- 1216 N Izard St
- 308 Trenton Rd
- 220 Lexington Dr
- 617 N Forrest St
- 1255 Chestnut St
- 654 N Forrest St
- 361 Yorktown Dr
- 1035 Fordham St
- 1021 Fordham St
- 1028 Princeton St
- 1022 Princeton St
- 1030 Princeton St
- 1013 Fordham St
- 1028 Fordham St
- 1034 Fordham St
- 1012 Princeton St
- 1022 Fordham St
- 1016 Fordham St
- 1005 Fordham St
- 906 Graham St
- 1004 Fordham St
- 1004 Princeton St
- 912 Graham St
- 1109 Bradley St
- 708 Oxford St
- 1005 Princeton St
- 809 Oxford St