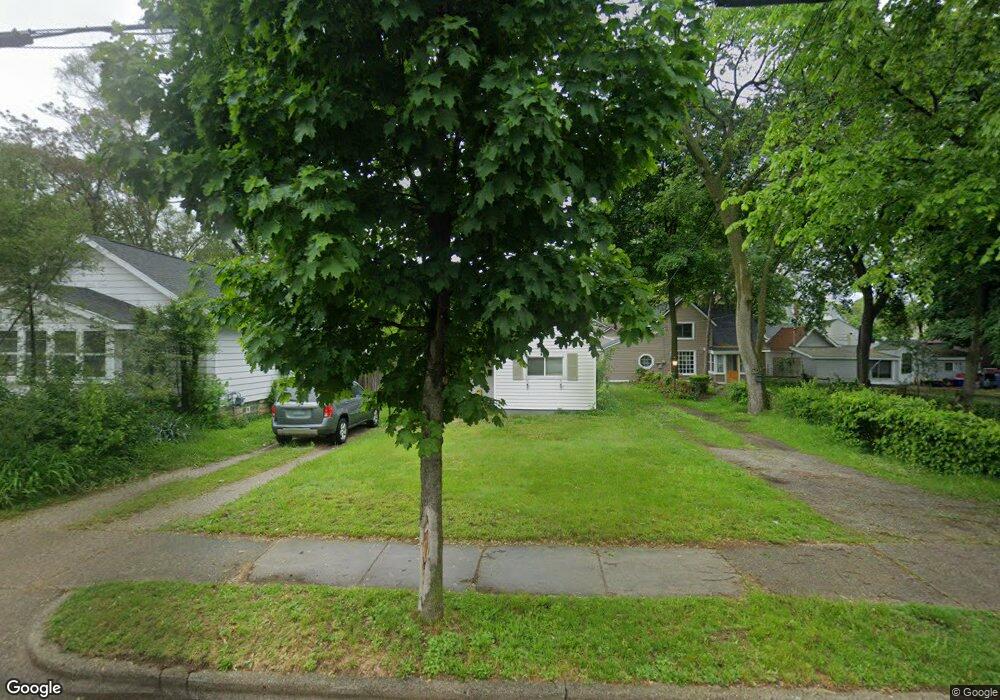
1029 Hazen St SE Grand Rapids, MI 49507
Alger Heights NeighborhoodEstimated Value: $179,000 - $203,000
2
Beds
1
Bath
806
Sq Ft
$242/Sq Ft
Est. Value
About This Home
This home is located at 1029 Hazen St SE, Grand Rapids, MI 49507 and is currently estimated at $195,015, approximately $241 per square foot. 1029 Hazen St SE is a home located in Kent County with nearby schools including Brookside Elementary School, Alger Middle School, and Ottawa Hills High School.
Ownership History
Date
Name
Owned For
Owner Type
Purchase Details
Closed on
Aug 4, 2004
Sold by
Hayes Kathi M
Bought by
Toronto Trisha A
Current Estimated Value
Home Financials for this Owner
Home Financials are based on the most recent Mortgage that was taken out on this home.
Original Mortgage
$77,677
Outstanding Balance
$39,411
Interest Rate
6.35%
Mortgage Type
FHA
Estimated Equity
$155,604
Purchase Details
Closed on
Nov 8, 1996
Sold by
Yocom Yocom B B and Yocom Hayes K
Bought by
Toronto Hayes K and Toronto Trisha A
Purchase Details
Closed on
Sep 27, 1994
Purchase Details
Closed on
Aug 17, 1994
Sold by
Lawrence Lawrence S S and Lawrence Yocom B
Bought by
Toronto Trisha A
Purchase Details
Closed on
Sep 21, 1993
Purchase Details
Closed on
Feb 20, 1991
Sold by
Group In and Group Lawrence S
Bought by
Toronto Trisha A
Purchase Details
Closed on
Jul 27, 1990
Sold by
Group Haverkamp M and Group In
Bought by
Toronto Trisha A
Purchase Details
Closed on
Sep 22, 1986
Create a Home Valuation Report for This Property
The Home Valuation Report is an in-depth analysis detailing your home's value as well as a comparison with similar homes in the area
Home Values in the Area
Average Home Value in this Area
Purchase History
| Date | Buyer | Sale Price | Title Company |
|---|---|---|---|
| Toronto Trisha A | $78,900 | -- | |
| Toronto Hayes K | $56,000 | -- | |
| -- | -- | -- | |
| Toronto Trisha A | $48,000 | -- | |
| -- | -- | -- | |
| Toronto Trisha A | $41,900 | -- | |
| Toronto Trisha A | $26,900 | -- | |
| -- | $24,000 | -- |
Source: Public Records
Mortgage History
| Date | Status | Borrower | Loan Amount |
|---|---|---|---|
| Open | Toronto Trisha A | $77,677 |
Source: Public Records
Tax History Compared to Growth
Tax History
| Year | Tax Paid | Tax Assessment Tax Assessment Total Assessment is a certain percentage of the fair market value that is determined by local assessors to be the total taxable value of land and additions on the property. | Land | Improvement |
|---|---|---|---|---|
| 2025 | $793 | $71,800 | $0 | $0 |
| 2024 | $793 | $66,900 | $0 | $0 |
| 2023 | $760 | $47,900 | $0 | $0 |
| 2022 | $764 | $45,100 | $0 | $0 |
| 2021 | $747 | $38,900 | $0 | $0 |
| 2020 | $714 | $34,400 | $0 | $0 |
| 2019 | $723 | $31,300 | $0 | $0 |
| 2018 | $723 | $24,200 | $0 | $0 |
| 2017 | $703 | $21,900 | $0 | $0 |
| 2016 | $712 | $20,100 | $0 | $0 |
| 2015 | $662 | $20,100 | $0 | $0 |
| 2013 | -- | $22,300 | $0 | $0 |
Source: Public Records
Map
Nearby Homes
- 1006 Merritt St SE
- 1043 Merrifield St SE
- 900 Hazen St SE
- 916 Ardmore St SE
- 863 Burton St SE
- 624 Hazen St SE
- 1177 Edna St SE
- 931 Griggs St SE
- 1335 Burton St SE
- 1029 Alger St SE
- 1119 Alger St SE
- 1863 Kalamazoo Ave SE
- 706 Winchell St SE
- 2066 Linden Ave SE
- 2072 Linden Ave SE
- 2050 Linden Ave SE
- 2058 Linden Ave SE
- 2098 Linden Ave SE
- 2120 Linden Ave SE
- 2053 Linden Ave SE
- 1025 Hazen St SE
- 1021 Hazen St SE
- 1037 Hazen St SE
- 1017 Hazen St SE
- 1041 Hazen St SE
- 1030 Merritt St SE
- 1036 Merritt St SE
- 1026 Merritt St SE
- 1045 Hazen St SE
- 1038 Merritt St SE
- 1013 Hazen St SE
- 1022 Merritt St SE
- 1030 Hazen St SE
- 1034 Hazen St SE
- 1046 Merritt St SE
- 1022 Hazen St SE
- 1018 Merritt St SE
- 1009 Hazen St SE
- 1040 Hazen St SE
- 1020 Hazen St SE