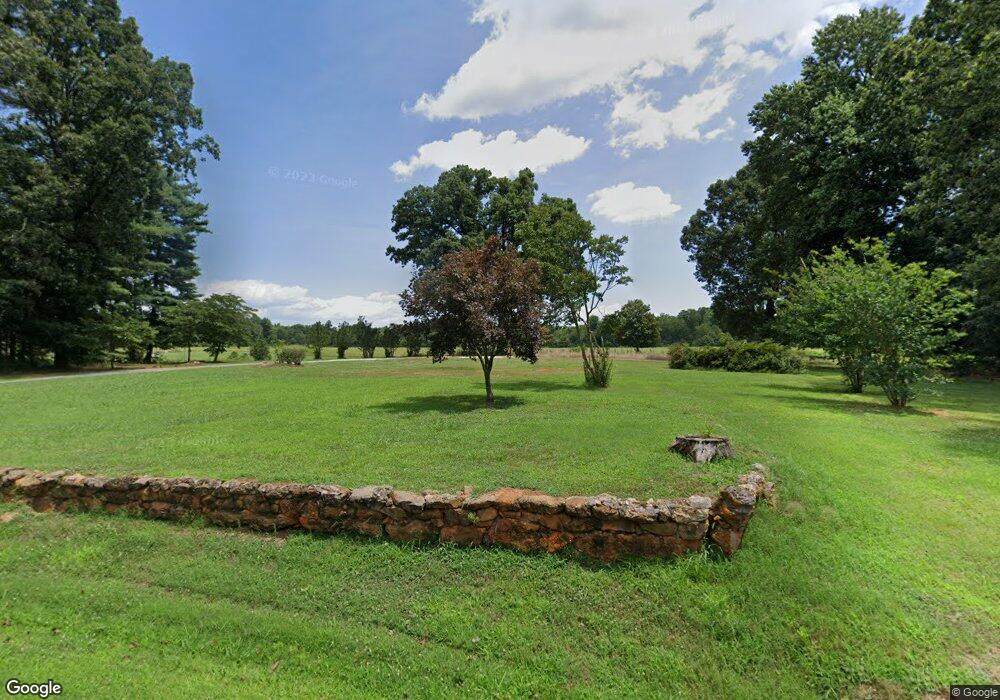
1029 Hephzibah Church Rd Crouse, NC 28033
Estimated Value: $473,000 - $966,998
3
Beds
1
Bath
2,399
Sq Ft
$300/Sq Ft
Est. Value
About This Home
This home is located at 1029 Hephzibah Church Rd, Crouse, NC 28033 and is currently estimated at $719,999, approximately $300 per square foot. 1029 Hephzibah Church Rd is a home with nearby schools including Tryon Elementary School, John Chavis Middle School, and Cherryville High School.
Ownership History
Date
Name
Owned For
Owner Type
Purchase Details
Closed on
Mar 21, 2024
Sold by
Gaston Land Company Llc
Bought by
Plnc Land Llc
Current Estimated Value
Purchase Details
Closed on
Oct 15, 2021
Sold by
Stephens Samuel J and Stephens Samuel J
Bought by
Gaston Land Company Llc
Purchase Details
Closed on
Aug 26, 2021
Sold by
Johnson John Albert and Johnson Charlene F
Bought by
Gaston Land Company Llc
Home Financials for this Owner
Home Financials are based on the most recent Mortgage that was taken out on this home.
Original Mortgage
$241,002
Interest Rate
2.96%
Mortgage Type
Purchase Money Mortgage
Purchase Details
Closed on
Jul 7, 2021
Sold by
Knowles Patricia R and Knowles Dallas E
Bought by
Gaston Land Company Llc
Home Financials for this Owner
Home Financials are based on the most recent Mortgage that was taken out on this home.
Original Mortgage
$241,002
Interest Rate
2.96%
Mortgage Type
Purchase Money Mortgage
Purchase Details
Closed on
Aug 1, 1983
Bought by
Knowles Patricia R and Knowles Dallas E
Create a Home Valuation Report for This Property
The Home Valuation Report is an in-depth analysis detailing your home's value as well as a comparison with similar homes in the area
Home Values in the Area
Average Home Value in this Area
Purchase History
| Date | Buyer | Sale Price | Title Company |
|---|---|---|---|
| Plnc Land Llc | -- | None Listed On Document | |
| Gaston Land Company Llc | -- | None Available | |
| Gaston Land Company Llc | -- | None Available | |
| Gaston Land Company Llc | $800,000 | None Available | |
| Knowles Patricia R | $1,000 | -- |
Source: Public Records
Mortgage History
| Date | Status | Borrower | Loan Amount |
|---|---|---|---|
| Previous Owner | Gaston Land Company Llc | $241,002 |
Source: Public Records
Tax History Compared to Growth
Tax History
| Year | Tax Paid | Tax Assessment Tax Assessment Total Assessment is a certain percentage of the fair market value that is determined by local assessors to be the total taxable value of land and additions on the property. | Land | Improvement |
|---|---|---|---|---|
| 2025 | $939 | $131,550 | $131,550 | $0 |
| 2024 | $4,007 | $561,260 | $131,550 | $429,710 |
| 2023 | $3,901 | $561,260 | $131,550 | $429,710 |
| 2022 | $2,841 | $213,570 | $11,740 | $201,830 |
| 2021 | $2,795 | $308,810 | $106,980 | $201,830 |
| 2019 | $2,094 | $308,810 | $106,980 | $201,830 |
| 2018 | $1,184 | $123,877 | $27,035 | $96,842 |
| 2017 | $1,134 | $123,877 | $27,035 | $96,842 |
| 2016 | $1,134 | $120,115 | $0 | $0 |
| 2014 | $1,147 | $121,496 | $30,035 | $91,461 |
Source: Public Records
Map
Nearby Homes
- 805 Hephzibah Church Rd
- 5219 Doe Meadow Ct
- 1026 Deer Creek Dr
- 0 Gaston-Webbs Chapel Rd
- 253 Suncrest Rd
- 3372 Crouse School Rd
- 215 Suncrest Rd
- 102 Aderholdt Rd
- 8 Swanson Rd
- 2724 Lincolnton Hwy
- 00 N Carolina 150
- 211 Forgotten Ln
- 2297 Swanson Rd
- 240 Hephzibah Church Rd
- 2336 Swanson Rd
- 2121 Hephzibah Church Rd
- 000 Mauney Rd
- 00 Mauney Rd
- 155 Rudisill Rd
- 0000 Dallas Cherryville Hwy
- 920 Hephzibah Church Rd
- 912 Hephzibah Church Rd
- 975 Hephzibah Church Rd
- 1028 Hephzibah Church Rd
- 1112 Hephzibah Church Rd
- 968 Whitesides Rd
- 1116 Hephzibah Church Rd
- 964 Whitesides Rd
- 942 Whitesides Rd
- 936 Whitesides Rd
- 1021 Hephzibah Church Rd
- 1035 Hephzibah Church Rd
- 1015 Hephzibah Church Rd
- 1136 Hephzibah Church Rd
- 1141 Hephzibah Church Rd
- 1139 Hephzibah Church Rd
- 928 Whitesides Rd
- 940 Hephzibah Church Rd
- 1139 Hephzibah Church Rd
- 1165 Hephzibah Church Rd