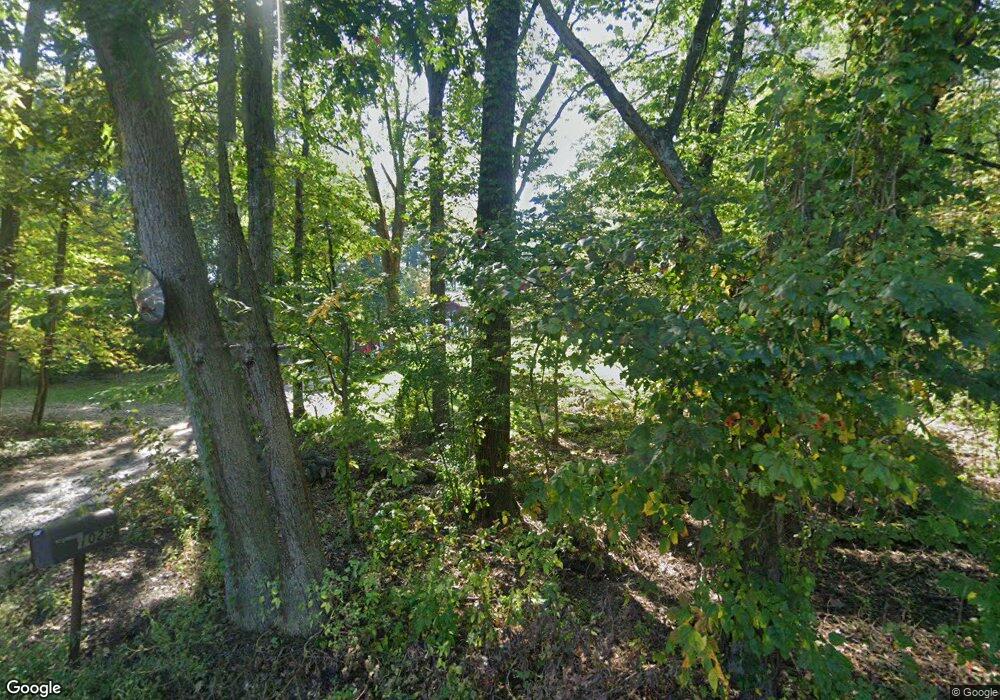
1029 Johnson St North Andover, MA 01845
Estimated Value: $926,562 - $1,018,000
3
Beds
3
Baths
2,200
Sq Ft
$442/Sq Ft
Est. Value
About This Home
This home is located at 1029 Johnson St, North Andover, MA 01845 and is currently estimated at $971,891, approximately $441 per square foot. 1029 Johnson St is a home located in Essex County with nearby schools including Annie L Sargent Elementary School, North Andover Middle School, and North Andover High School.
Ownership History
Date
Name
Owned For
Owner Type
Purchase Details
Closed on
Sep 29, 2000
Sold by
Rahasgejarm V C and Rajashekar Nalini
Bought by
Federico Mark Alfred and Federico Kristen M
Current Estimated Value
Home Financials for this Owner
Home Financials are based on the most recent Mortgage that was taken out on this home.
Original Mortgage
$205,000
Interest Rate
7.94%
Mortgage Type
Purchase Money Mortgage
Create a Home Valuation Report for This Property
The Home Valuation Report is an in-depth analysis detailing your home's value as well as a comparison with similar homes in the area
Home Values in the Area
Average Home Value in this Area
Purchase History
| Date | Buyer | Sale Price | Title Company |
|---|---|---|---|
| Federico Mark Alfred | $325,000 | -- |
Source: Public Records
Mortgage History
| Date | Status | Borrower | Loan Amount |
|---|---|---|---|
| Open | Federico Mark Alfred | $341,250 | |
| Closed | Federico Mark Alfred | $205,000 |
Source: Public Records
Tax History Compared to Growth
Tax History
| Year | Tax Paid | Tax Assessment Tax Assessment Total Assessment is a certain percentage of the fair market value that is determined by local assessors to be the total taxable value of land and additions on the property. | Land | Improvement |
|---|---|---|---|---|
| 2025 | $9,241 | $820,700 | $414,200 | $406,500 |
| 2024 | $8,637 | $778,800 | $392,400 | $386,400 |
| 2023 | $7,952 | $649,700 | $331,400 | $318,300 |
| 2022 | $7,870 | $581,700 | $287,800 | $293,900 |
| 2021 | $7,718 | $544,700 | $261,700 | $283,000 |
| 2020 | $7,185 | $522,900 | $255,100 | $267,800 |
| 2019 | $7,012 | $522,900 | $255,100 | $267,800 |
| 2018 | $7,598 | $522,900 | $255,100 | $267,800 |
| 2017 | $6,499 | $455,100 | $224,600 | $230,500 |
| 2016 | $7,169 | $502,400 | $226,700 | $275,700 |
| 2015 | $6,041 | $419,800 | $213,300 | $206,500 |
Source: Public Records
Map
Nearby Homes
- 127 Tucker Farm Rd
- 82 Raleigh Tavern Ln
- 43 Mill Rd
- 40 Flagship Dr
- 54 Sterling Ln
- 34 Rosemont Dr
- 105 Weyland Cir
- 120 Gray St
- 4 Buchan Rd
- 2 Buchan Rd
- 53 Old Cart Way
- 75 Thistle Rd
- 204 Chestnut St
- 124 Hillside Rd
- 180 Chestnut St
- 122 Lisa Ln
- 78 Salem St
- 26 Woodberry Ln
- 316 Johnson St
- 80 Compass Point Unit 80
- 1015 Johnson St
- 1041 Johnson St
- 1180 Turnpike St
- 1030 Johnson St
- 1174 Turnpike St
- 1174 /32-2 Turnpike St
- 1001 Johnson St
- 1057 Johnson St
- 1044 Johnson St
- 1010 Johnson St
- 1058 Johnson St
- 991 Johnson St
- 1000 Johnson St
- 1072 Johnson St
- 990 Johnson St
- 981 Johnson St
- 1112 Turnpike St
- G3 Turpike St Unit G3
- D4 Turpike St Unit D4
- 1208 Turnpike St
