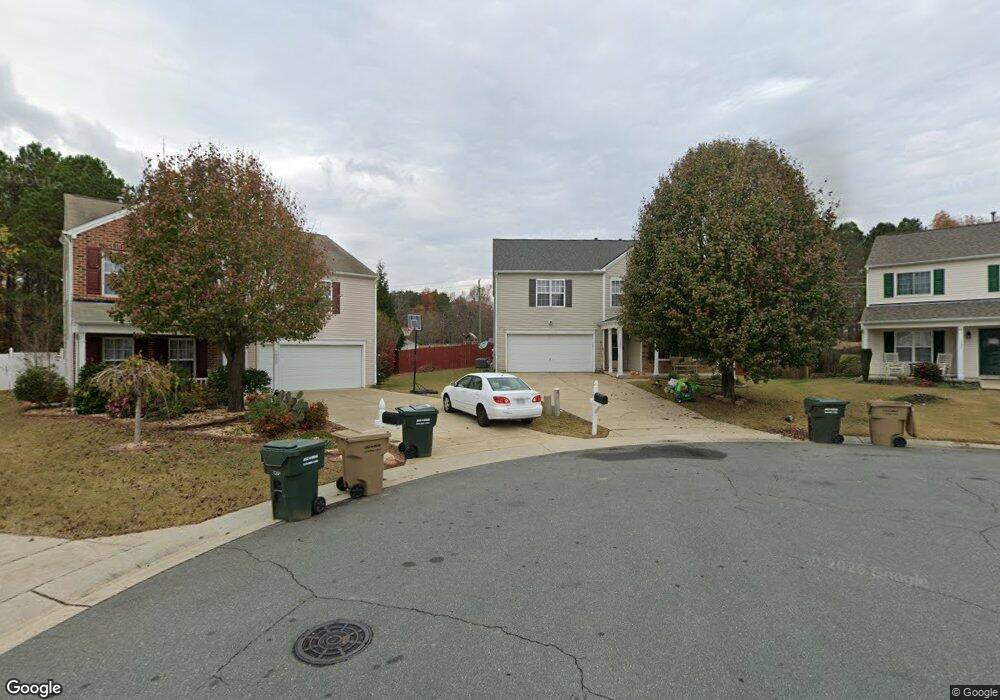
1029 Lockberry Ct Clayton, NC 27520
Estimated Value: $360,000 - $396,000
4
Beds
3
Baths
2,729
Sq Ft
$140/Sq Ft
Est. Value
About This Home
This home is located at 1029 Lockberry Ct, Clayton, NC 27520 and is currently estimated at $382,392, approximately $140 per square foot. 1029 Lockberry Ct is a home located in Johnston County with nearby schools including West Clayton Elementary School, Clayton Middle School, and Clayton High.
Ownership History
Date
Name
Owned For
Owner Type
Purchase Details
Closed on
Apr 24, 2020
Sold by
Stephenson Jerry and Stephenson Elisabeth Leith
Bought by
Stephenson Elisabeth Leith
Current Estimated Value
Home Financials for this Owner
Home Financials are based on the most recent Mortgage that was taken out on this home.
Original Mortgage
$169,000
Outstanding Balance
$144,187
Interest Rate
2.7%
Mortgage Type
New Conventional
Estimated Equity
$238,205
Purchase Details
Closed on
Dec 7, 2018
Sold by
Katlen Matthew S and Katlen Jennifer
Bought by
Grottini Anthony S
Home Financials for this Owner
Home Financials are based on the most recent Mortgage that was taken out on this home.
Original Mortgage
$230,743
Interest Rate
5.5%
Mortgage Type
FHA
Purchase Details
Closed on
Sep 4, 2015
Sold by
Katlen Tracy L
Bought by
Katlen Matthew S
Purchase Details
Closed on
Nov 12, 2004
Sold by
Katlen Matthew S
Bought by
Centex Homes
Create a Home Valuation Report for This Property
The Home Valuation Report is an in-depth analysis detailing your home's value as well as a comparison with similar homes in the area
Home Values in the Area
Average Home Value in this Area
Purchase History
| Date | Buyer | Sale Price | Title Company |
|---|---|---|---|
| Stephenson Elisabeth Leith | -- | None Available | |
| Grottini Anthony S | $235,000 | None Available | |
| Katlen Matthew S | -- | None Available | |
| Centex Homes | $177,500 | -- |
Source: Public Records
Mortgage History
| Date | Status | Borrower | Loan Amount |
|---|---|---|---|
| Open | Stephenson Elisabeth Leith | $169,000 | |
| Closed | Grottini Anthony S | $230,743 |
Source: Public Records
Tax History
| Year | Tax Paid | Tax Assessment Tax Assessment Total Assessment is a certain percentage of the fair market value that is determined by local assessors to be the total taxable value of land and additions on the property. | Land | Improvement |
|---|---|---|---|---|
| 2025 | $3,762 | $372,490 | $85,000 | $287,490 |
| 2024 | $3,132 | $237,240 | $48,000 | $189,240 |
| 2023 | $3,060 | $237,240 | $48,000 | $189,240 |
| 2022 | $3,155 | $237,240 | $48,000 | $189,240 |
| 2021 | $3,108 | $237,240 | $48,000 | $189,240 |
| 2020 | $3,179 | $237,240 | $48,000 | $189,240 |
| 2019 | $3,179 | $237,240 | $48,000 | $189,240 |
| 2018 | $2,686 | $197,520 | $37,000 | $160,520 |
| 2017 | $2,627 | $197,520 | $37,000 | $160,520 |
| 2016 | $2,627 | $197,520 | $37,000 | $160,520 |
| 2015 | $2,578 | $197,520 | $37,000 | $160,520 |
| 2014 | $2,578 | $197,520 | $37,000 | $160,520 |
Source: Public Records
Map
Nearby Homes
- 55 Tiger Eye Dr
- 39 Tiger Eye Dr
- 29 Tiger Eye Dr
- 23 Tiger Eye Dr
- 20 Tiger Eye Dr
- 8 Tiger Eye Dr
- 37 Pink Iris Ct
- 24 Pink Iris Ct
- 49 W Fire Opal Ct
- 54 E Fire Opal Ct
- 3001 Softwind Dr
- 1009 Narcissus Ct
- 1922 Parkside Village Dr
- 2016 Satinwood Dr
- 215 W Moss Creek Dr
- 166 Red Jasper Way
- 142 Red Jasper Way
- 176 Red Jasper Way
- 154 Red Jasper Way
- 18 E Fire Opal Ct
- 1025 Lockberry Ct
- 1024 Lockberry Ct
- 1021 Lockberry Ct
- 1020 Lockberry Ct
- 1016 Lockberry Ct
- 1017 Lockberry Ct
- 2399 Winston Rd
- 1021 Limeberry Ct
- 1012 Lockberry Ct
- 1013 Lockberry Ct
- 1017 Limeberry Ct
- 1013 Limeberry Ct
- 1025 Limeberry Ct
- 1008 Lockberry Ct
- 1009 Lockberry Ct
- 1004 Lockberry Ct
- 1005 Lockberry Ct
- 1005 Limeberry Ct
- 1020 Limeberry Ct
- 1000 Lockberry Ct
Your Personal Tour Guide
Ask me questions while you tour the home.