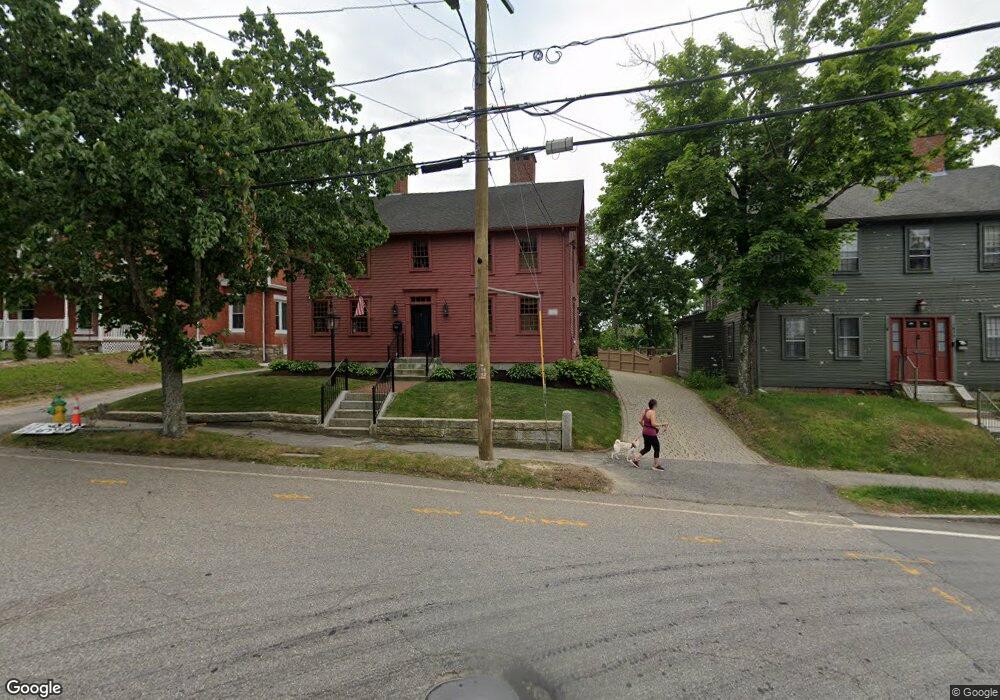
1029 Main St Leicester, MA 01524
Estimated Value: $478,000 - $583,000
4
Beds
2
Baths
2,620
Sq Ft
$198/Sq Ft
Est. Value
About This Home
This home is located at 1029 Main St, Leicester, MA 01524 and is currently estimated at $519,937, approximately $198 per square foot. 1029 Main St is a home located in Worcester County with nearby schools including Leicester Integrated Preschool, Leicester Memorial Elementary School, and Leicester Middle School.
Ownership History
Date
Name
Owned For
Owner Type
Purchase Details
Closed on
May 20, 2011
Sold by
Pnc Bank Na and Coy
Bought by
Arsenault Richard J and Arsenault Erika
Current Estimated Value
Purchase Details
Closed on
Jun 4, 1992
Sold by
Lepain Marc A and Lepain Patricia A
Bought by
Cody Ulmer S and Coy Linda
Create a Home Valuation Report for This Property
The Home Valuation Report is an in-depth analysis detailing your home's value as well as a comparison with similar homes in the area
Home Values in the Area
Average Home Value in this Area
Purchase History
| Date | Buyer | Sale Price | Title Company |
|---|---|---|---|
| Arsenault Richard J | $162,500 | -- | |
| Arsenault Richard J | $162,500 | -- | |
| Arsenault Richard J | $162,500 | -- | |
| Cody Ulmer S | $140,000 | -- | |
| Cody Ulmer S | $140,000 | -- |
Source: Public Records
Mortgage History
| Date | Status | Borrower | Loan Amount |
|---|---|---|---|
| Previous Owner | Cody Ulmer S | $151,000 | |
| Previous Owner | Cody Ulmer S | $136,000 |
Source: Public Records
Tax History Compared to Growth
Tax History
| Year | Tax Paid | Tax Assessment Tax Assessment Total Assessment is a certain percentage of the fair market value that is determined by local assessors to be the total taxable value of land and additions on the property. | Land | Improvement |
|---|---|---|---|---|
| 2025 | $54 | $458,200 | $59,500 | $398,700 |
| 2024 | $5,154 | $410,700 | $51,400 | $359,300 |
| 2023 | $4,810 | $374,000 | $51,400 | $322,600 |
| 2022 | $4,610 | $329,500 | $48,900 | $280,600 |
| 2021 | $4,949 | $327,100 | $48,900 | $278,200 |
| 2020 | $4,410 | $295,800 | $44,400 | $251,400 |
| 2019 | $4,316 | $286,200 | $40,000 | $246,200 |
| 2018 | $4,088 | $254,100 | $40,000 | $214,100 |
| 2017 | $3,933 | $254,100 | $40,000 | $214,100 |
| 2016 | $3,576 | $240,000 | $49,900 | $190,100 |
| 2015 | $3,490 | $240,000 | $49,900 | $190,100 |
Source: Public Records
Map
Nearby Homes
- 1029 Main St
- 1033 Main St
- 1025 Main St
- 1025 Main St Unit 2
- 1033 Main St
- 6 Paxton St
- 4 Paxton St
- 1019 Main St
- 9 S Main St Unit 71184186
- 9 S Main St Unit 71232177
- 9 S Main St Unit 71312607
- 9 S Main St
- 6 Market St
- 21 S Main St
- 9 S Main St
- 262 S Main St
- 15 S Main St
- 1041 Main St
- 1041 Main St Unit 2
- 1041 Main St Unit 3