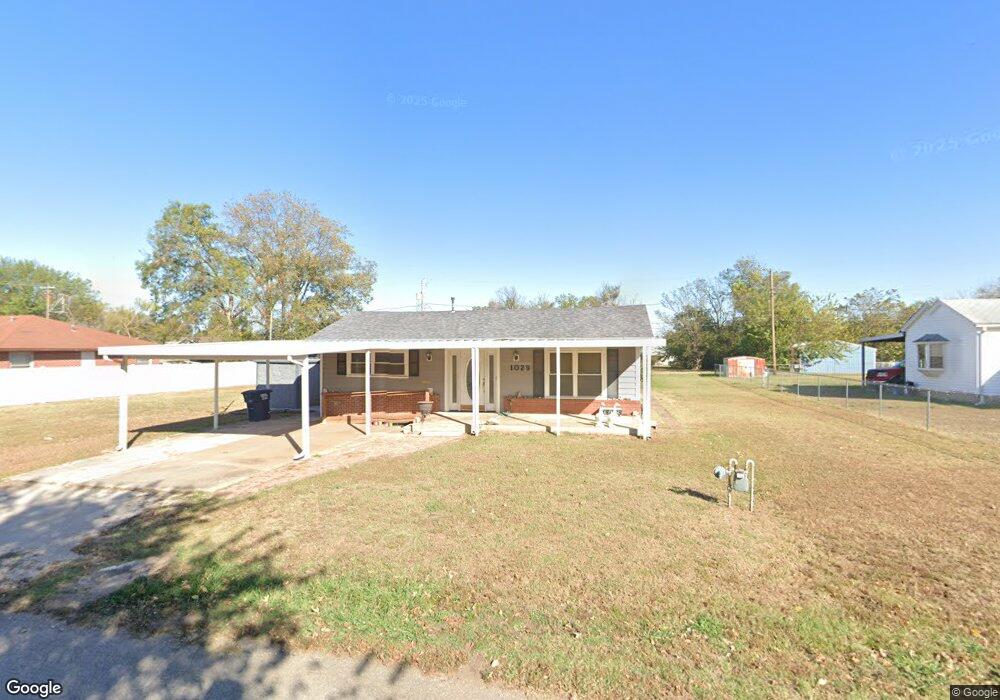
1029 N Tucker Ave Shawnee, OK 74801
Estimated Value: $111,000 - $133,000
3
Beds
1
Bath
1,671
Sq Ft
$73/Sq Ft
Est. Value
About This Home
This home is located at 1029 N Tucker Ave, Shawnee, OK 74801 and is currently estimated at $122,088, approximately $73 per square foot. 1029 N Tucker Ave is a home located in Pottawatomie County with nearby schools including Sequoyah Elementary School, Shawnee Middle School, and Shawnee High School.
Ownership History
Date
Name
Owned For
Owner Type
Purchase Details
Closed on
Mar 31, 2022
Sold by
Crecelius Ronald L
Bought by
Crecelius Ronald L
Current Estimated Value
Purchase Details
Closed on
Jun 29, 2021
Sold by
Crecelius Ronald
Bought by
Crecelius Ronald L and Gray Anthony Allen
Purchase Details
Closed on
Sep 26, 2016
Sold by
Jones Neal P and Jones Vera E
Bought by
Bolling James
Purchase Details
Closed on
Sep 1, 2015
Sold by
Gray Timothy James and Coray Anthony Allen
Bought by
Crecelius Ronald L and Crecelius Karen L
Purchase Details
Closed on
Nov 13, 2014
Sold by
Crecelius Karen Lee
Bought by
Gray Timothy James and Gray Anthony Allen
Create a Home Valuation Report for This Property
The Home Valuation Report is an in-depth analysis detailing your home's value as well as a comparison with similar homes in the area
Home Values in the Area
Average Home Value in this Area
Purchase History
| Date | Buyer | Sale Price | Title Company |
|---|---|---|---|
| Crecelius Ronald L | -- | None Listed On Document | |
| Crecelius Ronald L | $37,000 | None Available | |
| Bolling James | -- | Choice Title Insurance | |
| Crecelius Ronald L | -- | None Available | |
| Gray Timothy James | -- | None Available |
Source: Public Records
Tax History Compared to Growth
Tax History
| Year | Tax Paid | Tax Assessment Tax Assessment Total Assessment is a certain percentage of the fair market value that is determined by local assessors to be the total taxable value of land and additions on the property. | Land | Improvement |
|---|---|---|---|---|
| 2024 | $766 | $8,586 | $624 | $7,962 |
| 2023 | $766 | $8,336 | $624 | $7,712 |
| 2022 | $728 | $8,094 | $624 | $7,470 |
| 2021 | $691 | $7,858 | $624 | $7,234 |
| 2020 | $725 | $8,179 | $624 | $7,555 |
| 2019 | $766 | $8,339 | $624 | $7,715 |
| 2018 | $747 | $8,302 | $624 | $7,678 |
| 2017 | $747 | $8,398 | $624 | $7,774 |
| 2016 | $776 | $8,606 | $624 | $7,982 |
| 2015 | $776 | $8,754 | $624 | $8,130 |
| 2014 | $409 | $5,092 | $345 | $4,747 |
Source: Public Records
Map
Nearby Homes
- 907 N Mckinley Ave
- 000 N Mckinley Ave
- 730 N Tucker Ave
- 1003 N Minnesota Ave
- 710 N Tucker Ave
- 627 N Tucker Ave
- 1106 E Alice St
- 1102 E Alice
- 434 E Wallace St
- 544 N Elm Ave
- 1201 N Center Ave
- 535 N Patchin Ave
- 915 E Whittaker St
- 1214 E Edwards St
- 321 N Mckinley Ave
- 717 N Broadway Ave
- 0 E Fay St
- 1235 E Edwards St
- 1306 E Wallace St
- 727 N Beard Ave
- 1031 N Tucker Ave
- 700 E Dewey St
- 1033 N Tucker Ave
- 1035 N Tucker Ave
- 1004 N Mckinley Ave
- 1008 N Mckinley Ave
- 1014 N Tucker Ave
- 1002 N Mckinley Ave
- 1006 N Mckinley Ave
- 931 N Tucker Ave
- 1008 N Tucker Ave
- 1006 N Tucker Ave
- 721 E Wallace St
- 1012 N Tucker Ave
- 1002 N Tucker Ave
- 925 N Tucker Ave
- 912 N Mckinley Ave
- 1101 N Tucker Ave
- 1015 N Mckinley Ave
- 908 N Mckinley Ave