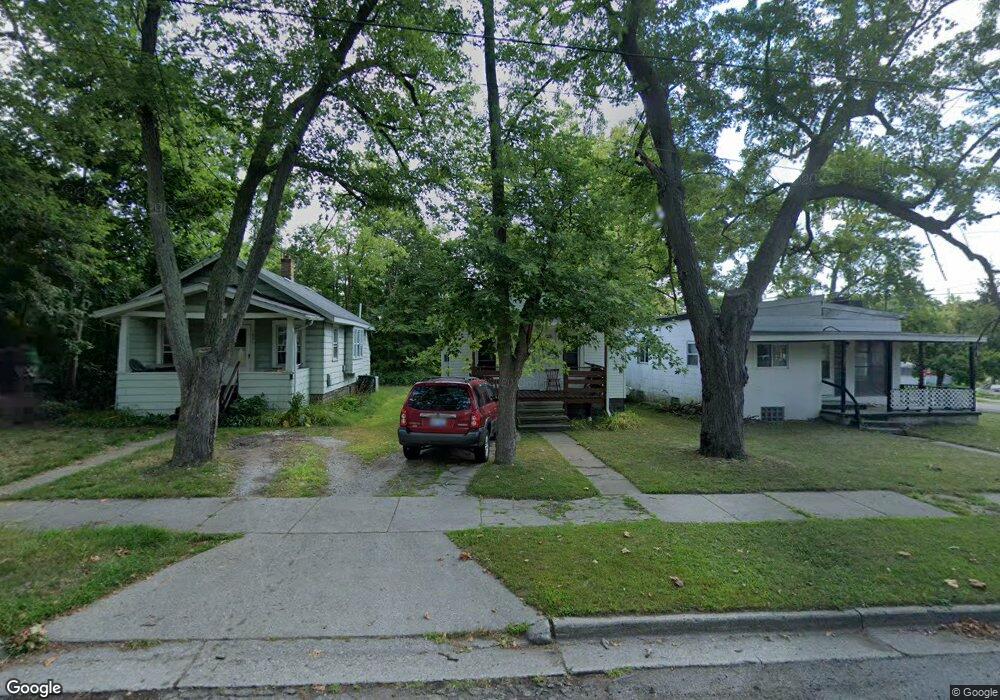
1029 Regent St Lansing, MI 48912
Potter Walsh NeighborhoodEstimated Value: $60,752 - $85,000
--
Bed
--
Bath
560
Sq Ft
$122/Sq Ft
Est. Value
About This Home
This home is located at 1029 Regent St, Lansing, MI 48912 and is currently estimated at $68,188, approximately $121 per square foot. 1029 Regent St is a home located in Ingham County with nearby schools including Pattengill Academy, Lyons Elementary School, and Eastern High School.
Ownership History
Date
Name
Owned For
Owner Type
Purchase Details
Closed on
Mar 25, 2004
Sold by
Stevenson Rutheta A
Bought by
Stevenson Matthew B
Current Estimated Value
Home Financials for this Owner
Home Financials are based on the most recent Mortgage that was taken out on this home.
Original Mortgage
$16,170
Interest Rate
5.66%
Mortgage Type
Stand Alone Refi Refinance Of Original Loan
Purchase Details
Closed on
Oct 21, 2003
Sold by
Mortgage Electronic Registration Systems
Bought by
Bank One Na
Purchase Details
Closed on
Aug 15, 2002
Sold by
Shatney Barry
Bought by
Mortgage Electronic Registration Systems
Purchase Details
Closed on
Mar 3, 2000
Sold by
Orlowski Stephen J and Orlowski Christy
Bought by
Travis Paul and Travis Joyce
Purchase Details
Closed on
Sep 1, 1992
Create a Home Valuation Report for This Property
The Home Valuation Report is an in-depth analysis detailing your home's value as well as a comparison with similar homes in the area
Home Values in the Area
Average Home Value in this Area
Purchase History
| Date | Buyer | Sale Price | Title Company |
|---|---|---|---|
| Stevenson Matthew B | -- | -- | |
| Bank One Na | -- | Fatic | |
| Mortgage Electronic Registration Systems | $17,910 | -- | |
| Travis Paul | $14,000 | -- | |
| -- | $9,000 | -- |
Source: Public Records
Mortgage History
| Date | Status | Borrower | Loan Amount |
|---|---|---|---|
| Closed | Stevenson Matthew B | $16,170 |
Source: Public Records
Tax History Compared to Growth
Tax History
| Year | Tax Paid | Tax Assessment Tax Assessment Total Assessment is a certain percentage of the fair market value that is determined by local assessors to be the total taxable value of land and additions on the property. | Land | Improvement |
|---|---|---|---|---|
| 2025 | $1,180 | $28,300 | $1,800 | $26,500 |
| 2024 | $1,109 | $23,900 | $1,800 | $22,100 |
| 2023 | $1,109 | $20,500 | $1,800 | $18,700 |
| 2022 | $1,272 | $18,100 | $1,700 | $16,400 |
| 2021 | $1,243 | $15,900 | $1,800 | $14,100 |
| 2020 | $1,234 | $15,500 | $1,800 | $13,700 |
| 2019 | $1,189 | $15,100 | $1,800 | $13,300 |
| 2018 | $1,130 | $13,900 | $1,800 | $12,100 |
| 2017 | $1,086 | $13,900 | $1,800 | $12,100 |
| 2016 | $1,066 | $13,600 | $1,800 | $11,800 |
| 2015 | $1,066 | $13,400 | $3,554 | $9,846 |
| 2014 | $1,066 | $13,500 | $2,666 | $10,834 |
Source: Public Records
Map
Nearby Homes
- 1225 Regent St
- 1204 Shepard St
- 701 S Fairview Ave
- 727 S Magnolia Ave
- 637 S Clemens Ave
- 1128 Lathrop St
- 607 Shepard St Unit 2
- 624 S Hayford Ave
- 528 S Fairview Ave
- 1019 Dakin St
- 517 S Clemens Ave
- 515 S Clemens Ave
- 629 S Foster Ave
- 523 Clifford St
- 329 S Clemens Ave
- 412 S Hayford Ave
- 1200 S Holmes St
- 404 S Hayford Ave
- 910 S Holmes St
- 426 S Francis Ave
- 1027 Regent St
- 1033 Regent St
- 11 Walsh St
- 1103 Regent St
- 81 Regent St
- 1032 Regent St
- 1024 Regent St
- 1107 Regent St
- 1020 Regent St
- 1109 Regent St
- 1100 Regent St
- 1016 Regent St
- 1106 S Clemens Ave
- 77 Regent St
- 1012 Regent St
- 1111 Regent St
- 1106 Regent St
- 1110 S Clemens Ave
- 1008 Regent St
- 704 Aurelius Rd