Estimated Value: $279,000 - $296,000
3
Beds
2
Baths
1,828
Sq Ft
$157/Sq Ft
Est. Value
About This Home
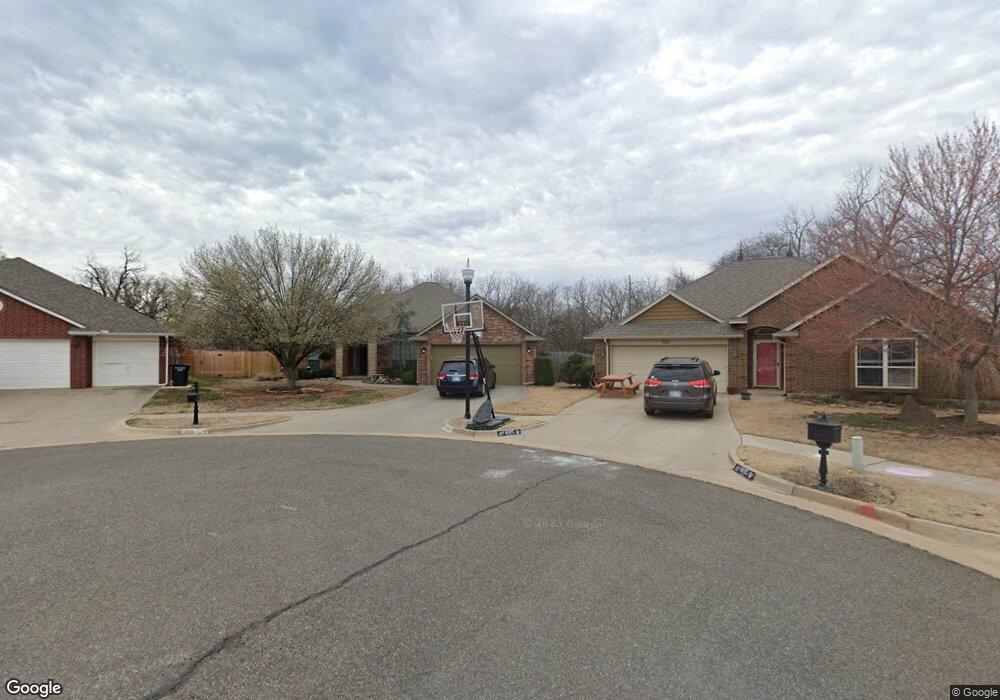
This home is located at 1029 Renita Ct, Moore, OK 73160 and is currently estimated at $287,236, approximately $157 per square foot. 1029 Renita Ct is a home located in Cleveland County with nearby schools including Heritage Trails Elementary School, Highland East Junior High School, and Moore High School.
Ownership History
Date
Name
Owned For
Owner Type
Purchase Details
Closed on
Jun 4, 2012
Sold by
Midgett Matthew W
Bought by
Jones Sean A and Bennett Jones Julie A
Current Estimated Value
Home Financials for this Owner
Home Financials are based on the most recent Mortgage that was taken out on this home.
Original Mortgage
$165,000
Outstanding Balance
$114,726
Interest Rate
3.9%
Mortgage Type
VA
Estimated Equity
$172,510
Purchase Details
Closed on
May 2, 2008
Sold by
Burcham Steven and Burcham Marta S
Bought by
Midgett Matthew W
Home Financials for this Owner
Home Financials are based on the most recent Mortgage that was taken out on this home.
Original Mortgage
$140,000
Interest Rate
5.84%
Mortgage Type
New Conventional
Purchase Details
Closed on
Jan 30, 2006
Sold by
Dinnes Investments Llc
Bought by
Burcham Steven and Burcham Marta
Home Financials for this Owner
Home Financials are based on the most recent Mortgage that was taken out on this home.
Original Mortgage
$156,655
Interest Rate
6.24%
Mortgage Type
New Conventional
Purchase Details
Closed on
Jul 27, 2005
Sold by
Methvin Enterprises Inc
Bought by
Sun Contracting Llc
Create a Home Valuation Report for This Property
The Home Valuation Report is an in-depth analysis detailing your home's value as well as a comparison with similar homes in the area
Home Values in the Area
Average Home Value in this Area
Purchase History
| Date | Buyer | Sale Price | Title Company |
|---|---|---|---|
| Jones Sean A | $178,000 | None Available | |
| Midgett Matthew W | $175,000 | None Available | |
| Burcham Steven | $165,000 | None Available | |
| Sun Contracting Llc | $25,000 | None Available |
Source: Public Records
Mortgage History
| Date | Status | Borrower | Loan Amount |
|---|---|---|---|
| Open | Jones Sean A | $165,000 | |
| Previous Owner | Midgett Matthew W | $140,000 | |
| Previous Owner | Burcham Steven | $156,655 |
Source: Public Records
Tax History Compared to Growth
Tax History
| Year | Tax Paid | Tax Assessment Tax Assessment Total Assessment is a certain percentage of the fair market value that is determined by local assessors to be the total taxable value of land and additions on the property. | Land | Improvement |
|---|---|---|---|---|
| 2024 | $3,275 | $26,995 | $5,788 | $21,207 |
| 2023 | $3,134 | $25,709 | $5,699 | $20,010 |
| 2022 | $3,029 | $24,485 | $5,456 | $19,029 |
| 2021 | $2,898 | $23,319 | $4,788 | $18,531 |
| 2020 | $2,820 | $22,684 | $4,510 | $18,174 |
| 2019 | $2,735 | $21,604 | $3,600 | $18,004 |
| 2018 | $2,691 | $21,251 | $3,000 | $18,251 |
| 2017 | $2,706 | $21,251 | $0 | $0 |
| 2016 | $2,725 | $21,251 | $3,000 | $18,251 |
| 2015 | $2,350 | $20,259 | $3,106 | $17,153 |
| 2014 | $2,406 | $20,259 | $3,106 | $17,153 |
Source: Public Records
Map
Nearby Homes
- 1009 Ashwood Ln
- 908 Cottonwood Dr
- 1308 Anns Place
- 1712 SE 12th St
- 705 Cottonwood Dr
- 2433 SE 12th St
- 1104 Silver Maple
- 624 Applewood St
- 2100 SE 5th St
- 1105 Spruce Dr
- 1013 Kelsi Dr
- 1336 Brice Dr
- 1912 SE 18th St
- 1109 Jacob Dr
- 1517 SE 6th St
- 1126 Jacob Dr
- 401 S Bryant Ave
- Taylor Plan at Cypress Creek
- 1809 Parkway Dr
- 2632 SE 7th St
- 1025 Renita Ct
- 1033 Renita Ct
- 1101 Renita Way
- 1021 Renita Ct
- 1105 Renita Way
- 1017 Renita Way
- 1109 Renita Way
- 1013 Renita Way
- 1113 Renita Way
- 1009 Renita Way
- 1100 Renita Way
- 1104 Renita Way
- 1020 Renita Way
- 1016 Renita Way
- 1117 Renita Way
- 1913 SE 12th St
- 1108 Renita Way
- 1007 Renita Way
- 1300 Knollwood Terrace
- 1112 Renita Way