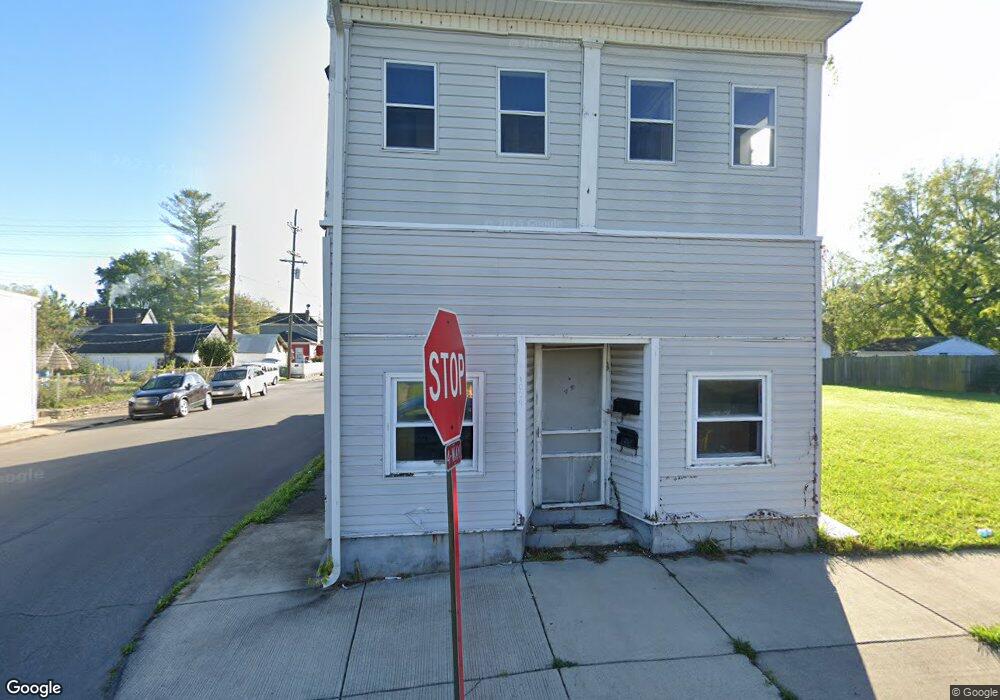
1029 Sheridan St Richmond, IN 47374
Estimated Value: $62,000 - $90,463
2
Beds
1
Bath
2,268
Sq Ft
$32/Sq Ft
Est. Value
About This Home
This home is located at 1029 Sheridan St, Richmond, IN 47374 and is currently estimated at $72,866, approximately $32 per square foot. 1029 Sheridan St is a home located in Wayne County with nearby schools including Fairview Elementary School, Dennis Middle School, and Richmond High School.
Ownership History
Date
Name
Owned For
Owner Type
Purchase Details
Closed on
May 29, 2025
Sold by
Hallmark Investment Group Llc
Bought by
Walker Briannah Anissa Jaily
Current Estimated Value
Purchase Details
Closed on
Jun 22, 2022
Sold by
Cordine John D
Bought by
Gateholder Llc
Purchase Details
Closed on
Jun 1, 2021
Sold by
Ellison Bobby
Bought by
Cordine John D
Create a Home Valuation Report for This Property
The Home Valuation Report is an in-depth analysis detailing your home's value as well as a comparison with similar homes in the area
Home Values in the Area
Average Home Value in this Area
Purchase History
| Date | Buyer | Sale Price | Title Company |
|---|---|---|---|
| Walker Briannah Anissa Jaily | $60,000 | None Listed On Document | |
| Gateholder Llc | -- | Hocker Janet Davis | |
| Cordine John D | -- | None Available |
Source: Public Records
Tax History Compared to Growth
Tax History
| Year | Tax Paid | Tax Assessment Tax Assessment Total Assessment is a certain percentage of the fair market value that is determined by local assessors to be the total taxable value of land and additions on the property. | Land | Improvement |
|---|---|---|---|---|
| 2024 | $800 | $40,000 | $3,300 | $36,700 |
| 2023 | $702 | $35,100 | $2,900 | $32,200 |
| 2022 | $710 | $35,500 | $2,900 | $32,600 |
| 2021 | $413 | $34,700 | $2,900 | $31,800 |
| 2020 | $390 | $34,700 | $2,900 | $31,800 |
| 2019 | $359 | $34,400 | $2,900 | $31,500 |
| 2018 | $348 | $34,400 | $2,900 | $31,500 |
| 2017 | $668 | $33,400 | $2,900 | $30,500 |
| 2016 | $692 | $34,600 | $2,900 | $31,700 |
| 2014 | $672 | $33,600 | $2,900 | $30,700 |
| 2013 | $672 | $32,500 | $2,900 | $29,600 |
Source: Public Records
Map
Nearby Homes
- 1122 Sheridan St
- 948 Sheridan St
- 1111 Crosshall St
- 1034 Boyer St
- 1218 Crosshall St
- 124 NW I St
- 100 NW G St
- 106 NW G St
- 225 NW J St
- 1410 Ridge St
- 1405 Ratliff St
- 0 Turner Rd Unit 10049707
- 0 S 37th St Unit 26.35 A DEVELOPMENT
- 123 Richmond Ave
- 1441 Hunt St
- 645 N 10th St
- 0 S C St
- LOT 6 Leisure Village Unit 1210 S Q STREET
- Multiple Unit See Remarks
- 414 NW 3rd St
- 1027 Sheridan St
- 1103 Sheridan St
- 1023 Sheridan St
- 1021 Sheridan St
- 1107 Sheridan St
- 1019 Sheridan St
- 1028 Butler St
- 1024 Butler St
- 1100 Butler St
- 1028 Sheridan St
- 1020 Butler St
- 1024 Sheridan St
- 1104 Butler St
- 1115 Sheridan St
- 1115 Sheridan St
- 1106 Sheridan St
- 1020 Sheridan St
- 1106 Butler St
- 1016 Sheridan St
- 1014 Butler St