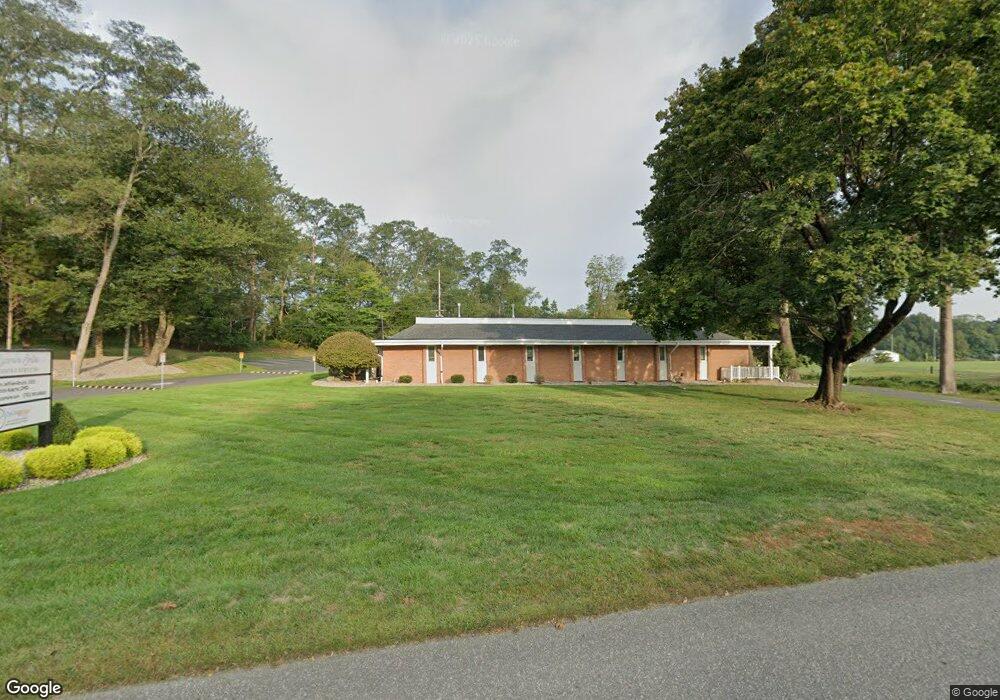
1029 Sycamore Ave Tinton Falls, NJ 07724
Estimated Value: $1,210,792
--
Bed
--
Bath
5,405
Sq Ft
$224/Sq Ft
Est. Value
About This Home
This home is located at 1029 Sycamore Ave, Tinton Falls, NJ 07724 and is currently estimated at $1,210,792, approximately $224 per square foot. 1029 Sycamore Ave is a home located in Monmouth County with nearby schools including Mahala F. Atchinson Elementary School, Swimming River Elementary School, and Tinton Falls Middle School.
Ownership History
Date
Name
Owned For
Owner Type
Purchase Details
Closed on
Mar 25, 2021
Sold by
Diamond Real Estate Holdings Llc
Bought by
Brocck Holdings Llc
Current Estimated Value
Home Financials for this Owner
Home Financials are based on the most recent Mortgage that was taken out on this home.
Original Mortgage
$651,500
Interest Rate
3.1%
Mortgage Type
Small Business Administration
Purchase Details
Closed on
Mar 1, 2010
Sold by
Sycamore Professional Building Inc
Bought by
Diamond Real Estate Holdings Llc
Home Financials for this Owner
Home Financials are based on the most recent Mortgage that was taken out on this home.
Original Mortgage
$525,000
Interest Rate
5%
Mortgage Type
Commercial
Purchase Details
Closed on
Nov 17, 2009
Sold by
Furman Margaret Ann
Bought by
Sycamore Professional Building Inc
Create a Home Valuation Report for This Property
The Home Valuation Report is an in-depth analysis detailing your home's value as well as a comparison with similar homes in the area
Home Values in the Area
Average Home Value in this Area
Purchase History
| Date | Buyer | Sale Price | Title Company |
|---|---|---|---|
| Brocck Holdings Llc | $800,000 | Columbus Title Services Llc | |
| Diamond Real Estate Holdings Llc | $725,000 | None Available | |
| Sycamore Professional Building Inc | -- | Stewart Title Guaranty Co |
Source: Public Records
Mortgage History
| Date | Status | Borrower | Loan Amount |
|---|---|---|---|
| Previous Owner | Brocck Holdings Llc | $651,500 | |
| Previous Owner | Diamond Real Estate Holdings Llc | $525,000 |
Source: Public Records
Tax History Compared to Growth
Tax History
| Year | Tax Paid | Tax Assessment Tax Assessment Total Assessment is a certain percentage of the fair market value that is determined by local assessors to be the total taxable value of land and additions on the property. | Land | Improvement |
|---|---|---|---|---|
| 2025 | $12,269 | $813,200 | $264,600 | $548,600 |
| 2024 | $12,828 | $843,800 | $269,000 | $574,800 |
| 2023 | $12,828 | $834,100 | $264,600 | $569,500 |
| 2022 | $15,674 | $807,500 | $264,600 | $542,900 |
| 2021 | $19,602 | $809,200 | $294,000 | $515,200 |
| 2020 | $19,681 | $981,600 | $367,500 | $614,100 |
| 2019 | $19,602 | $980,100 | $367,500 | $612,600 |
| 2018 | $19,397 | $967,900 | $367,500 | $600,400 |
| 2017 | $19,723 | $960,200 | $367,500 | $592,700 |
| 2016 | $19,826 | $945,000 | $367,500 | $577,500 |
| 2015 | $19,440 | $937,300 | $367,500 | $569,800 |
| 2014 | $15,762 | $725,000 | $441,000 | $284,000 |
Source: Public Records
Map
Nearby Homes
- 31 Branford Cir
- 56 Mulberry Ln
- 834 Sycamore Ave
- 26 Rambling Meadow Ct
- 19 Helene Ct Unit 19
- 43 Midway Rd N
- 29 Oak Ln
- 103 Barker Ave
- 3 Jockey Terrace N
- 66 Barker Ave
- 40 Barker Ave
- 19 Belshaw Ave
- 8 Ann Ct
- 416 Crawford St
- 34 Barker Ave
- 28 Belshaw Ave
- 20 Barker Ave
- 712 Sycamore Ave
- 2 Columbia Dr
- 17 High Point Rd